Transforming Industrial Operations with AI-Powered Insights
Cogn8 is a leading industrial AI platform -” A comprehensive redesign focused on data liberation, anomaly detection, and iterative intelligence to support operational excellence.
The Challenge: Detecting the "Silent" Failures
In wind energy operations, standard monitoring systems often miss subtle anomalies that indicate looming failures. A classic example is "Sudden Low Turbine Speed" despite "Steady Wind Conditions".
The Problem: Traditional threshold-based alarms trigger only when values cross extreme limits. By then, it's often too late. We needed a system that understands the relationship between variables-”recognizing that low RPM is only a problem when the wind is blowing strong.
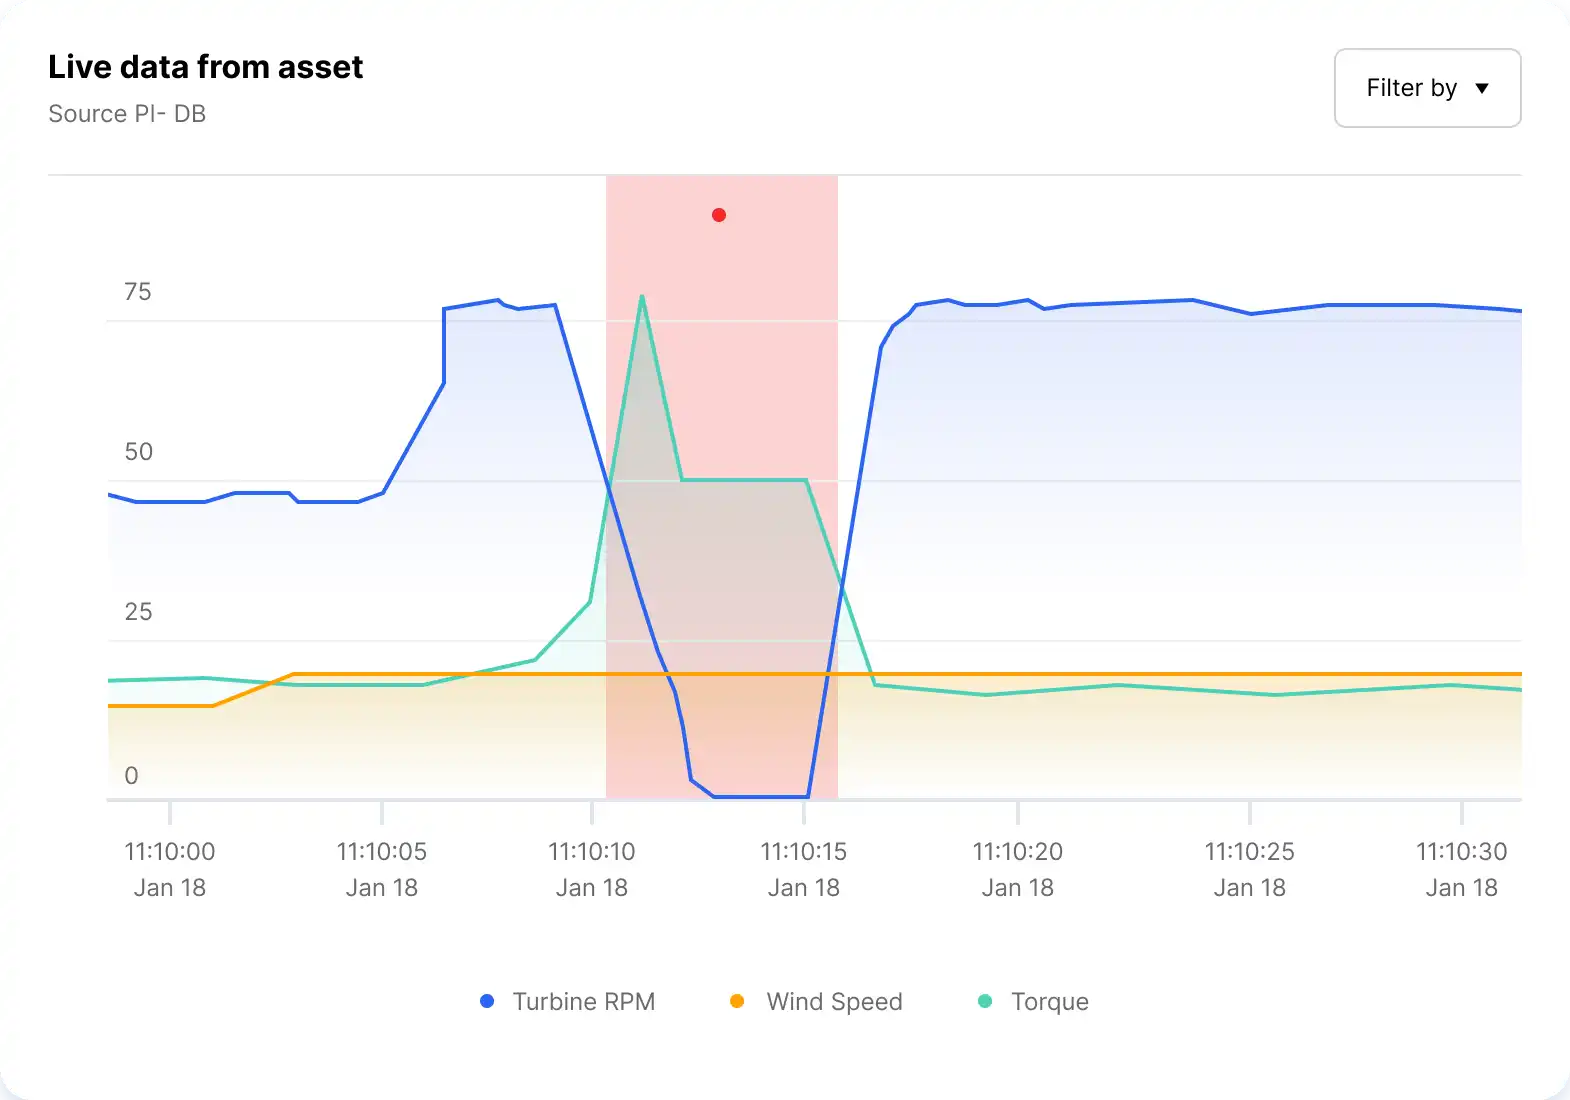
Unwanted Behavior
Anomaly: Turbine speed (Black) drops suddenly while
Wind speed
(Orange) remains steady.
Result: Potential gearbox failure or efficiency loss.
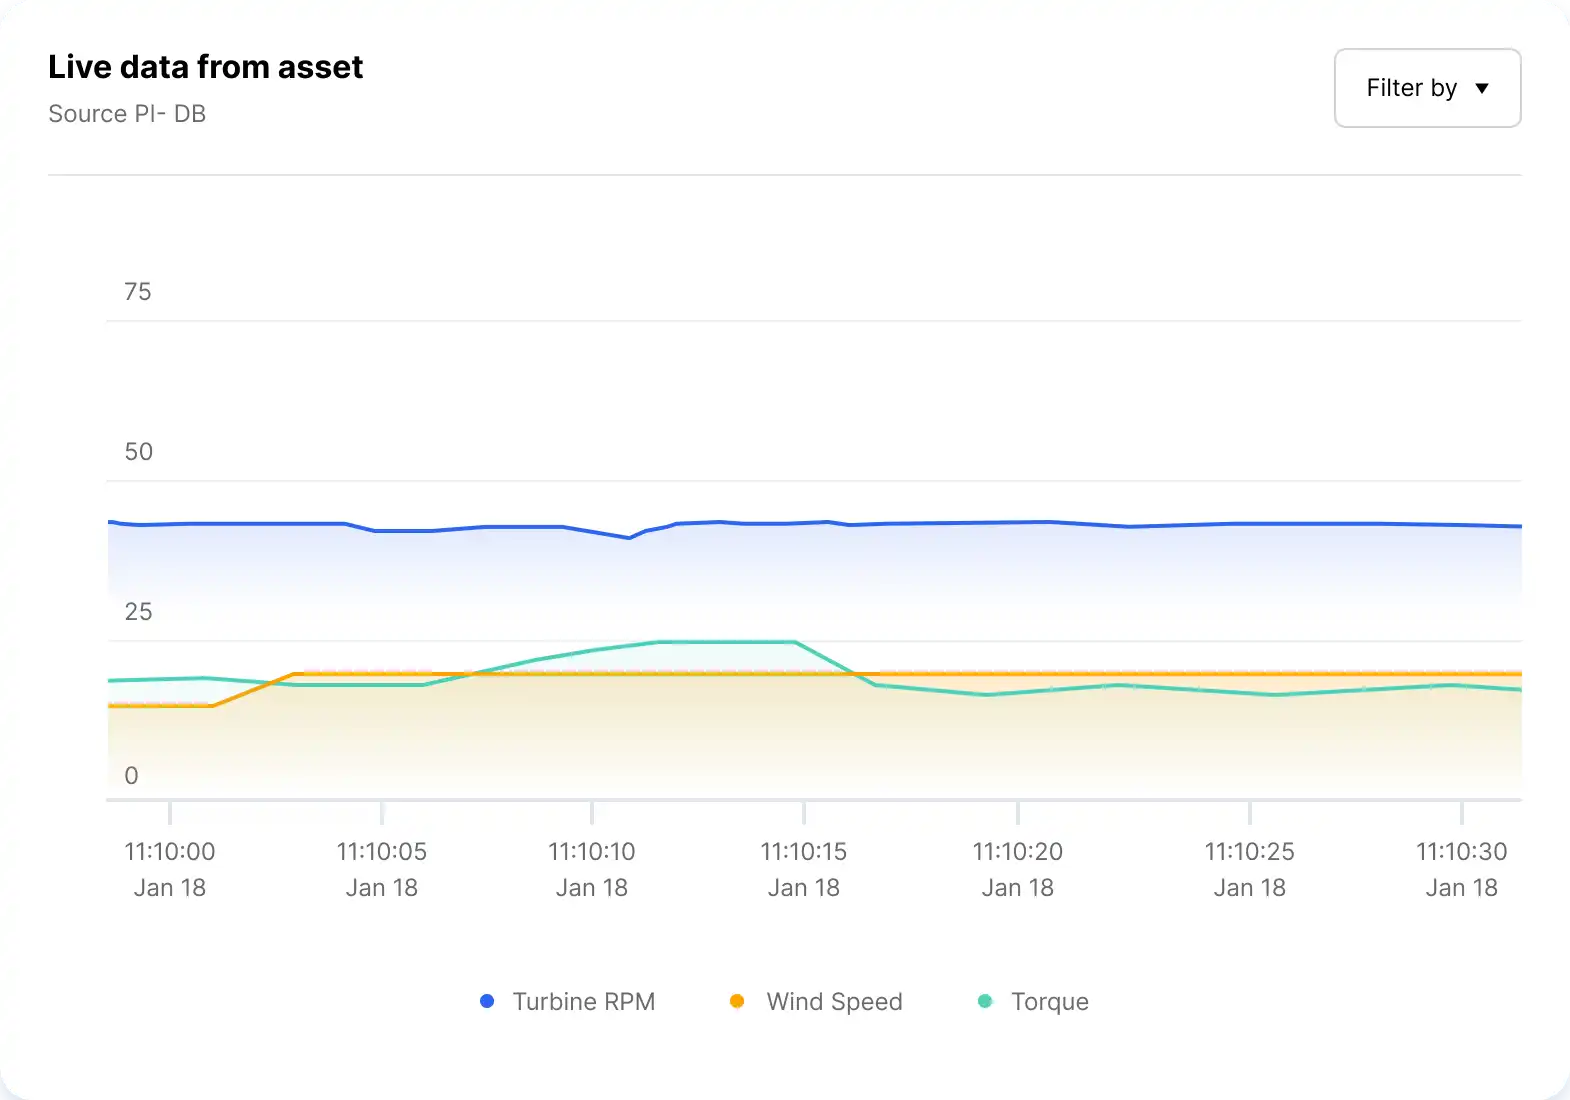
OK Behavior
Normal Operation: Turbine speed drops, but it
correlates with a
drop in Wind speed.
Result: System behaving as expected.
Strategic Vision: Human-Machine Collaboration
The Gap
Machine learning excels at monitoring vast data streams for abnormalities but lacks context. Humans understand context but cannot monitor 24/7.
The Strategy
"Glass Box" Collaboration. The AI acts as a transparent "Watchdog" flagging issues with evidence, while the Engineer acts as the "Judge" validating findings to train the system.
Wind Turbine Data Analysis
Our AI analyzes three critical metrics ”RPM, Wind Speed, and Torque”to classify operational states and detect anomalies before they cause failures.
Core Data Components
RPM
Rotations Per Minute - measures turbine rotational speed
Critical for detecting performance anomalies and mechanical stress
Wind Speed
Environmental wind velocity affecting turbine operation
Key input for expected performance benchmarking
Torque
Rotational force applied to the turbine drivetrain
Indicates mechanical load and potential component stress
Anomaly Classification Framework
Normal State
RPM & Low WindExpected operational conditions without system stress
Continuous monitoringTurbine Issues
High Torque, RPM & Low WindAbnormal load or control issues within turbine system
Medium PriorityParts Issues
High Torque & Wind, Low RPMWear or malfunction in bearings, gearboxes, or moving parts
High PriorityBlade/System Issues
High Wind, Low RPM & TorqueBlade damage, system faults, or sensor misalignments
High PriorityResearch & Discovery
Research Strategy
Directing Discovery. I orchestrated a multi-method research strategy to uncover the "why" behind the resistance to AI. By combining ethnographic field studies with quantitative analysis, I identified that the core barrier was not "usability" but "trust."
In-depth interviews across roles
Industrial facility observations
Hours of contextual inquiry
Survey responses analyzed
Key Research Insights
Weekly Time Loss Per Engineer (Hours)
Analysis of how industrial engineers spend non-productive time due to system inefficiencies
Impact: An average of 47 hours per week wasted across non-productive activities ”representing 118% productivity loss per engineer.
User Satisfaction with Current Systems
Prioritized Pain Points
Cannot trust data accuracy across systems
Alert fatigue from excessive false positives
No visibility into why AI flags anomalies
Complex navigation between 10+ systems
Lack of historical context for decisions
Key Research Insight
"We don't need more data we're drowning in it. What we need is confidence that what the system is telling us is actually true. I need to understand why it's flagging something, see the evidence, and make the call myself."
-” Senior Maintenance Engineer, Offshore Energy Platform (15 years experience)
This insight revealed a fundamental shift needed: from building "smarter AI" to building "more transparent AI" that empowers human decision-making rather than attempting to replace it.
Heuristic Evaluation & Remote Research
In parallel with field studies, I conducted comprehensive heuristic evaluations of existing industrial SCADA systems and remote research sessions with operators unable to participate in on-site studies due to shift schedules and geographic constraints.
Heuristic Evaluation Findings
Visibility of System Status
No clear indicators of AI confidence or data quality.
Error Prevention
No warnings before critical threshold changes.
Recognition vs Recall
Users must memorize sensor IDs instead of meaningful names.
Flexibility
No customization options for different user roles.
Remote Research Insights
Conducted 8 remote sessions via video calls with screen sharing.
Reached offshore platform workers and night-shift operators.
Observed real-time workflows during actual alert investigations.
Uncovered mobile usage patterns and connectivity challenges.
Ideation & Design Strategy
Based on research insights, I established design principles grounded in explainable AI, human-centered design, and cognitive load theory. Each principle directly addresses a documented user need.
Core Design Principles
Proactive Intelligence
Shift from reactive alerts to predictive warnings giving teams time to prevent issues rather than scrambling to fix them
Predictive warnings reduced emergency responses by 35%
Trust Through Verification
Enable users to validate AI conclusions with source data and confidence metrics-”building trust incrementally
Research showed only 23% initially trusted automated detection
Human-in-the-Loop Design
Design feedback mechanisms that let users teach the system creating a collaborative intelligence partnership
Systems with feedback loops showed 68% better long-term accuracy
Progressive Disclosure
Surface critical information first, allow deep-dives on demand reducing cognitive load while preserving access to detail
Users reported 40% faster decision-making with layered information
Context Over Data
Prioritize actionable insights over raw metrics answer 'what should I do' before 'what happened'
Field workers prefer action recommendations 4:1 over data dashboards
Explainable AI
Make AI reasoning transparent and understandable show users why the system flagged an anomaly, not just that it did
Based on finding that 73% of users override unexplained AI recommendations
Feature Mapping & Prioritization
I organized potential features into thematic groups using affinity mapping with stakeholders. Each category addresses specific pain points from research, with features prioritized using the RICE framework (Reach, Impact, Confidence, Effort).
Transparency & Trust
- Confidence scores for every AI prediction
- Visual reasoning paths showing detection logic
- Source data traceability for verification
- Historical accuracy metrics per anomaly type
Contextual Intelligence
- Asset relationship visualization
- Temporal pattern analysis
- Cross-system data correlation
- Maintenance history integration
Actionable Insights
- Recommended actions with impact assessment
- Priority-based anomaly triage
- Risk-level classification
- Time-to-action estimates
The Solution: Agentic Automation
We evolved from "Human-in-the-Loop" to "Human-on-the-Loop". The Agentic AI autonomously detects anomalies, identifies the root cause, and executes corrective actions in milliseconds notifying the engineer only for critical oversight.
Turbine #42: Autonomous Correction Active
Demo Telemetry: Real-Time Analysis
Performance Comparison
Quantitative Impact: Before vs After
Key metrics 3 months before vs 6 months after implementation
User Satisfaction Analysis
Multi-dimensional satisfaction scores (n=43 users)
AI Performance Metrics
Anomaly Detection Performance Over Time
AI system learning from human feedback-”declining false positives demonstrate improving precision.
False Positives
Precision
Data Quality Evolution
Multi-dimensional quality metrics improving as AI clustering and structuring mature.
Overall Quality
Improvement
AI Capabilities & Techniques
Unsupervised Clustering
K-means and hierarchical clustering to identify patterns in operational data and group similar anomaly types
LLM-Powered Structuring
Large Language Models parse unstructured maintenance logs, sensor notes, and documentation into structured knowledge graphs
Real-Time Anomaly Detection
Time-series analysis with LSTM networks and statistical methods to identify deviations from normal operational patterns
Knowledge Graph Integration
Semantic connections between assets, sensors, maintenance history, and operational context for enriched insights
Multi-Source Data Fusion
Bayesian networks combine data from SCADA, IoT sensors, ERP, and maintenance systems with confidence weighting
Self-Aware Learning Loop
System monitors its own prediction accuracy and adapts thresholds based on human feedback and outcome validation
AI-Powered Classification
Historical Incidents analyzed
Classification accuracy
Average diagnosis time
Understanding Self-Aware AI
The term "self-aware" in this context doesn't imply consciousness-”it refers to an AI system's ability to monitor its own performance, recognize its limitations, and adapt its behavior based on feedback loops. This includes:
- Detection: Identifying when predictions may be uncertain or unreliable
- Reflection: Analyzing which types of anomalies it detects accurately vs. those requiring human validation
- Adaptation: Adjusting detection thresholds and confidence levels based on historical accuracy
Financial Impact
Value derived from: reduced downtime ($4.2M), productivity gains ($2.8M), maintenance optimization ($1.2M), and improved asset lifespan ($0.5M)
Results & Impact
The implementation of Cogn8's AI-driven solution delivered measurable improvements in efficiency, safety, and data reliability across global operations.
Reduction in noise
Per engineer / week
True positive rate
Avoided shutdowns
Up from 35%
Generated per facility
Design Showcase
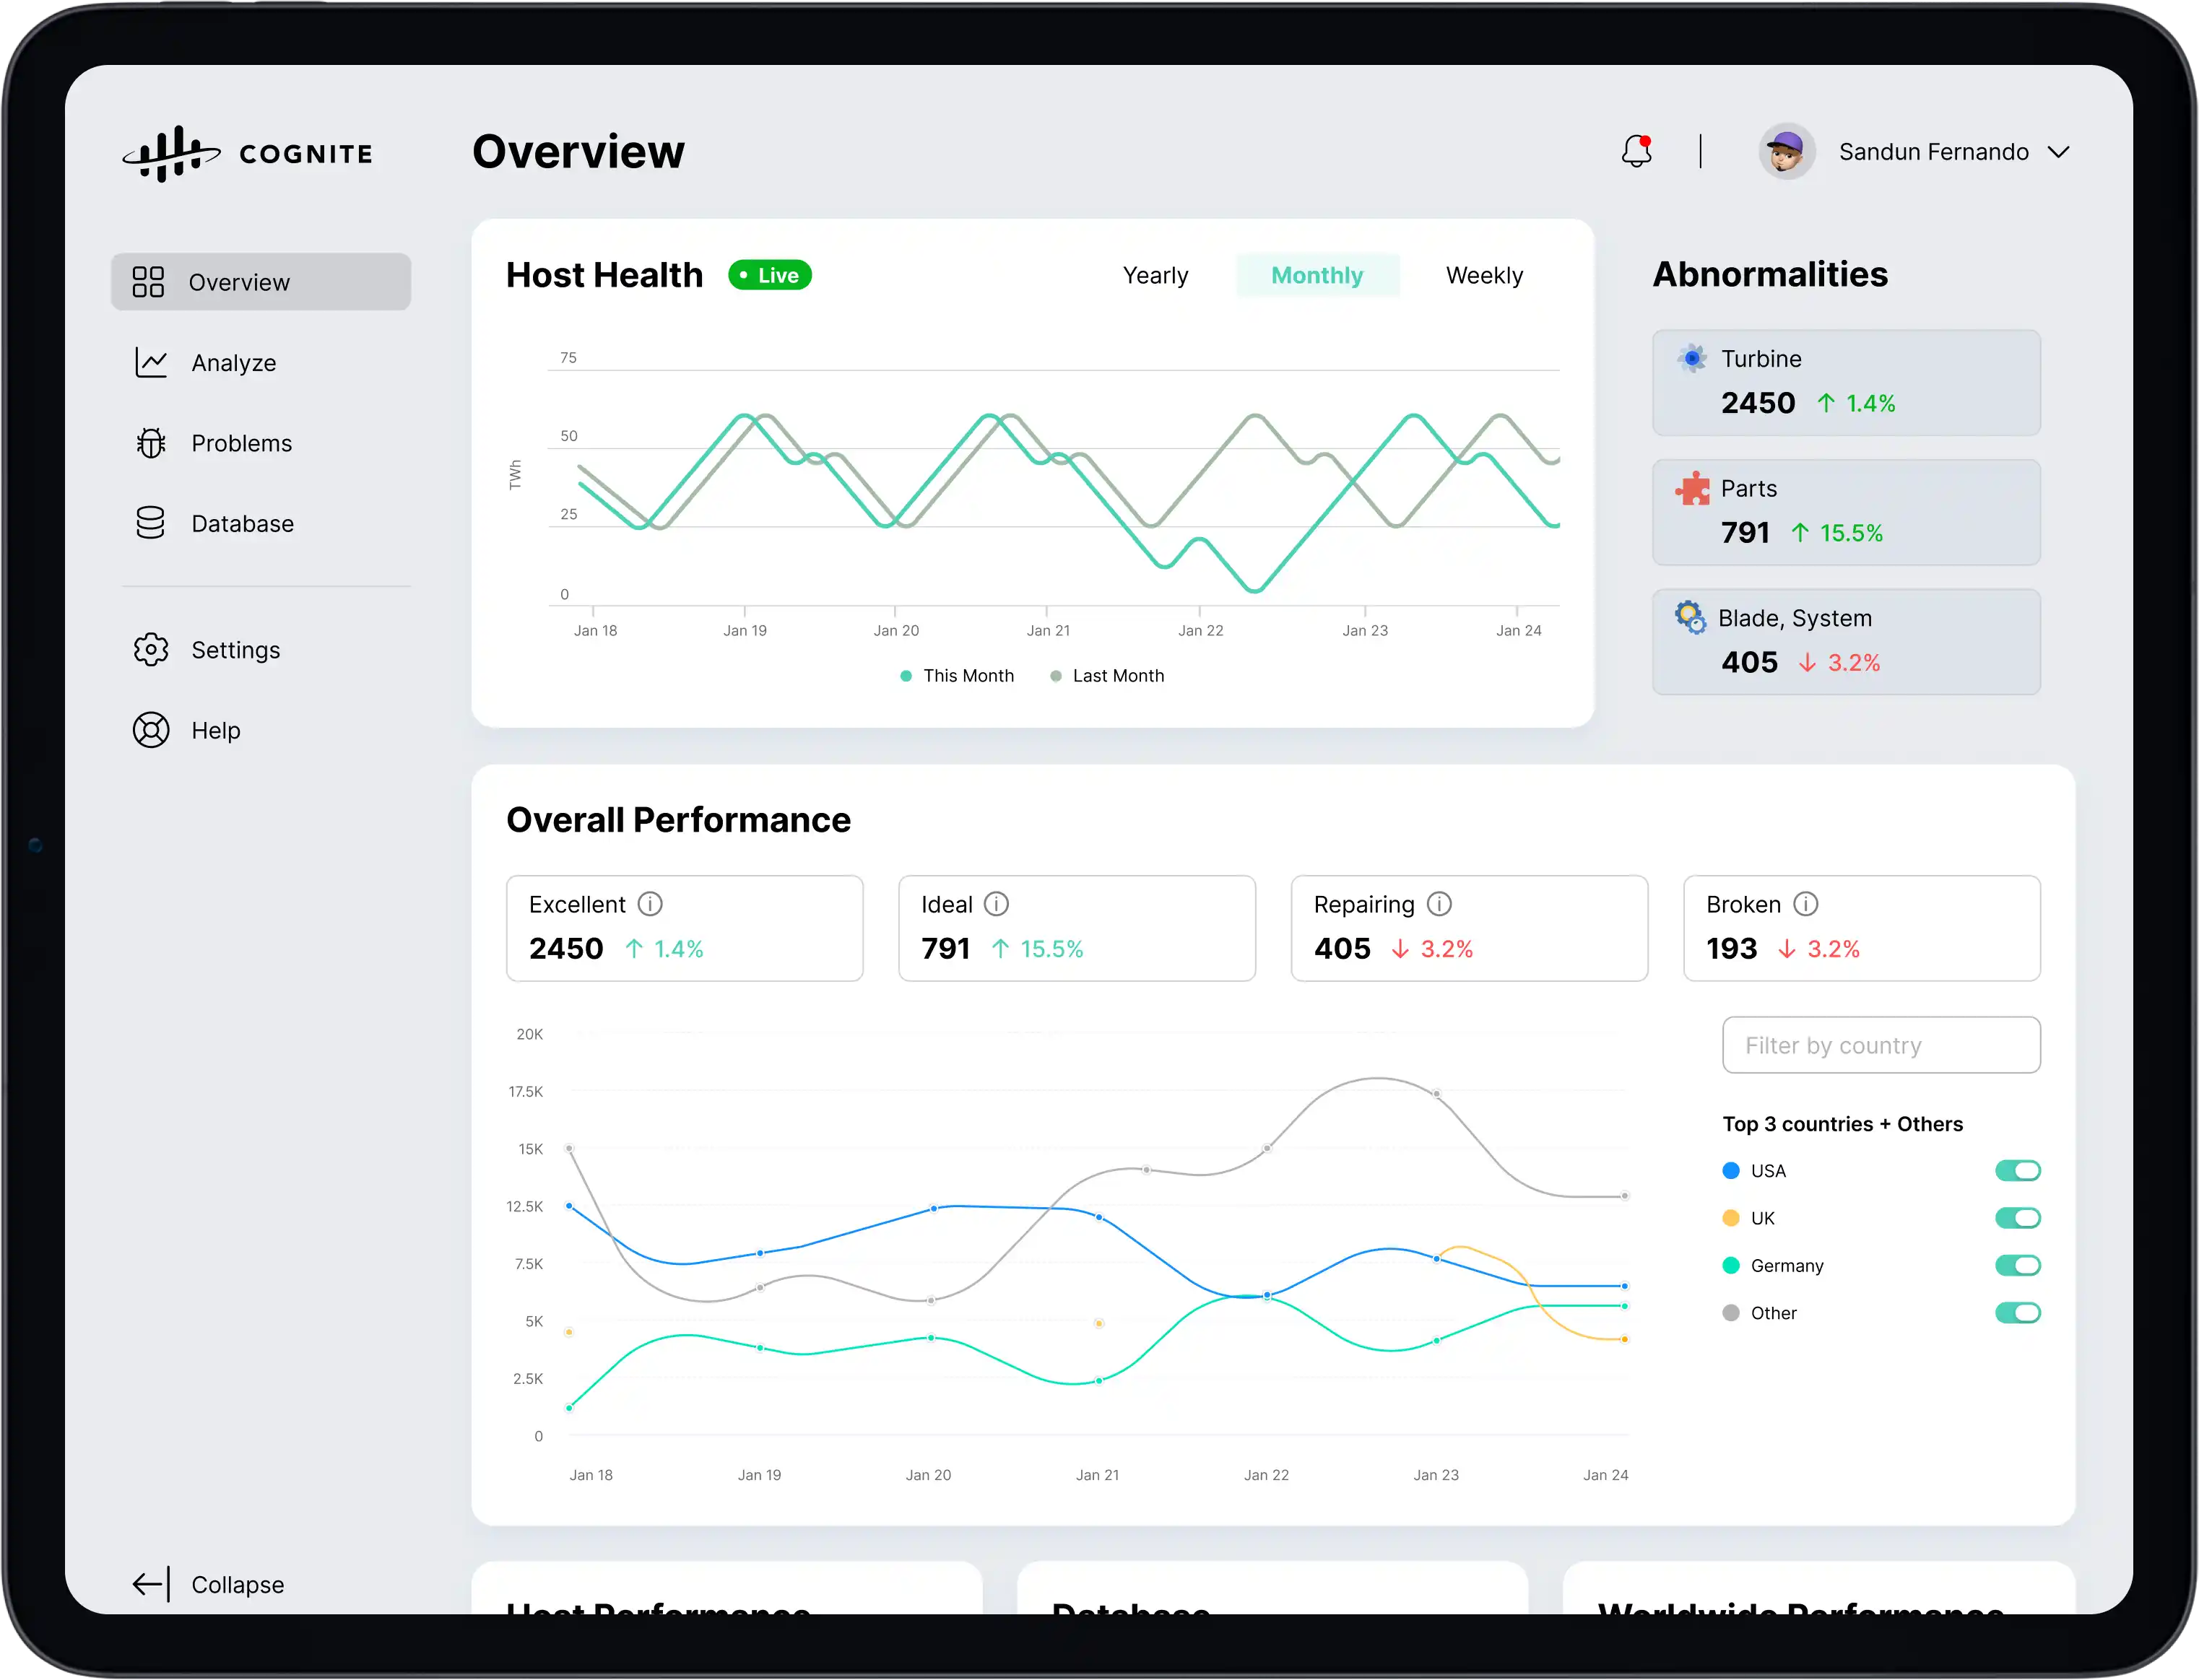
Global Operations Dashboard
A centralized command center providing real-time visibility into global asset health, operational efficiency, and critical alerts across all facility locations.
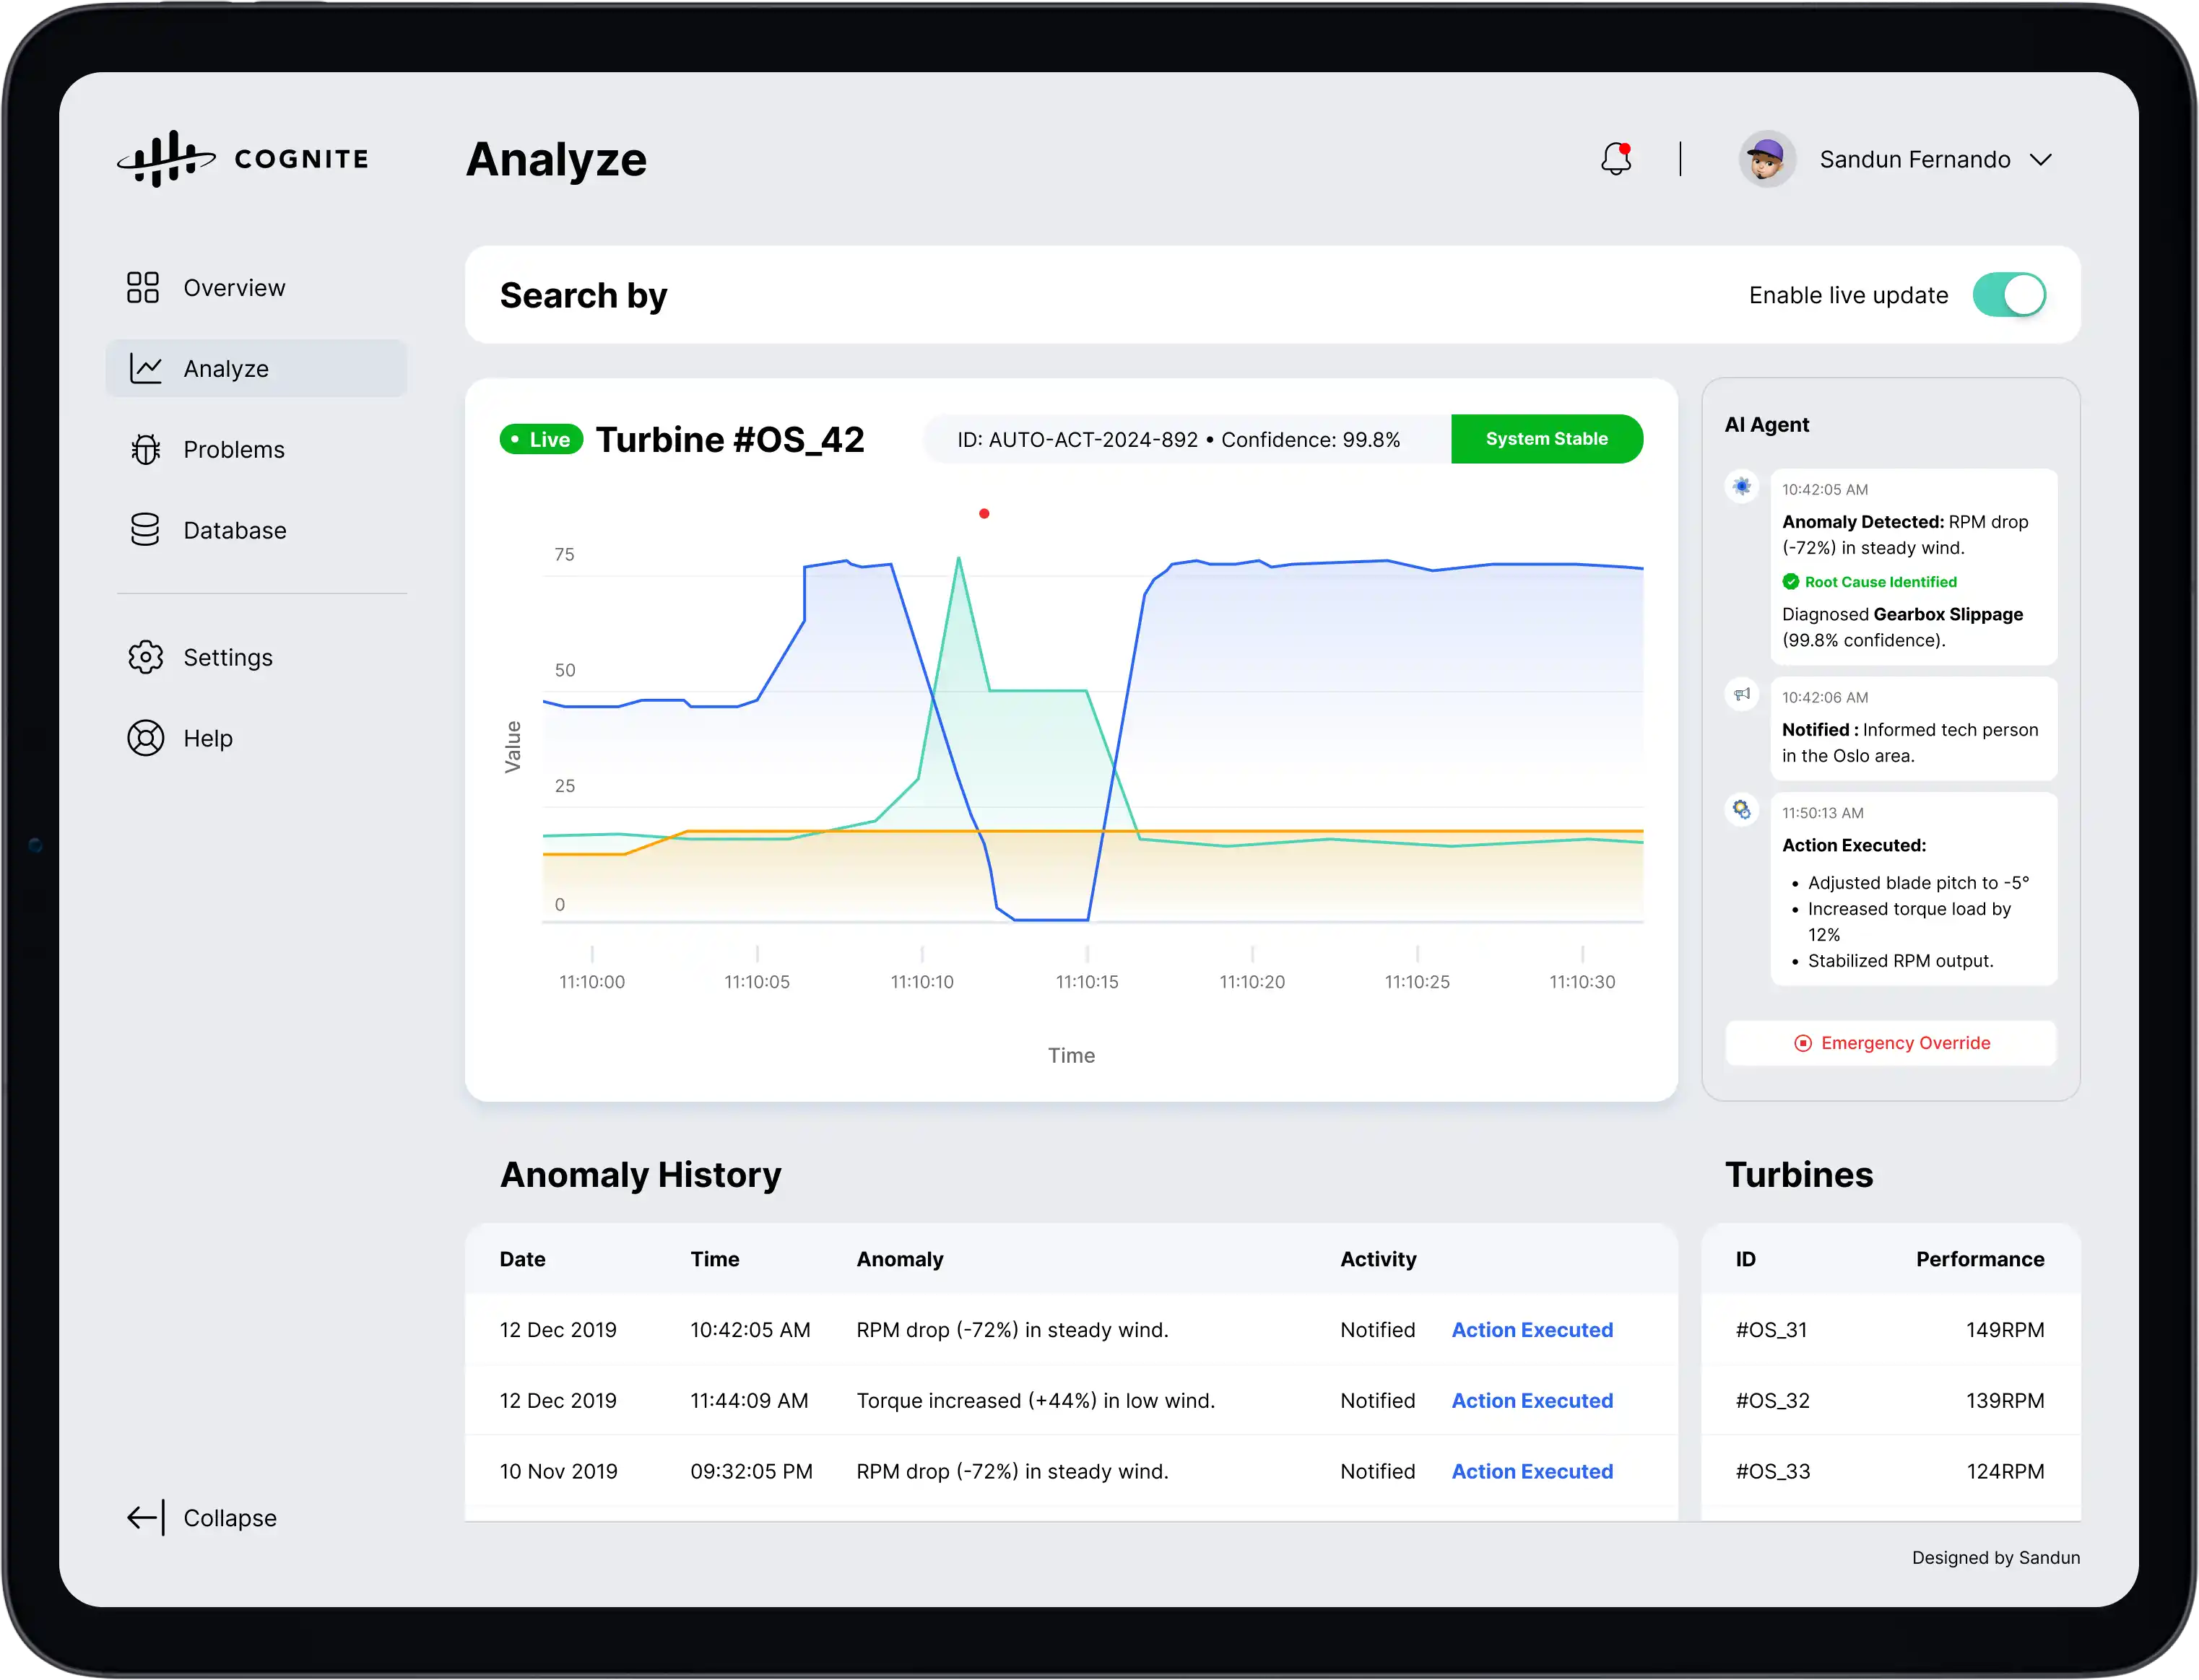
Individual Turbine AI Analysis
AI-driven diagnostics overlaying predictive insights on turbine schematics, highlighting potential failure points before they impact proactive maintenance.

Individual Turbine Manual Analysis
Detailed telemetry view allowing engineers to drill down into specific sensor data, comparing historical benchmarks against real-time performance metrics.
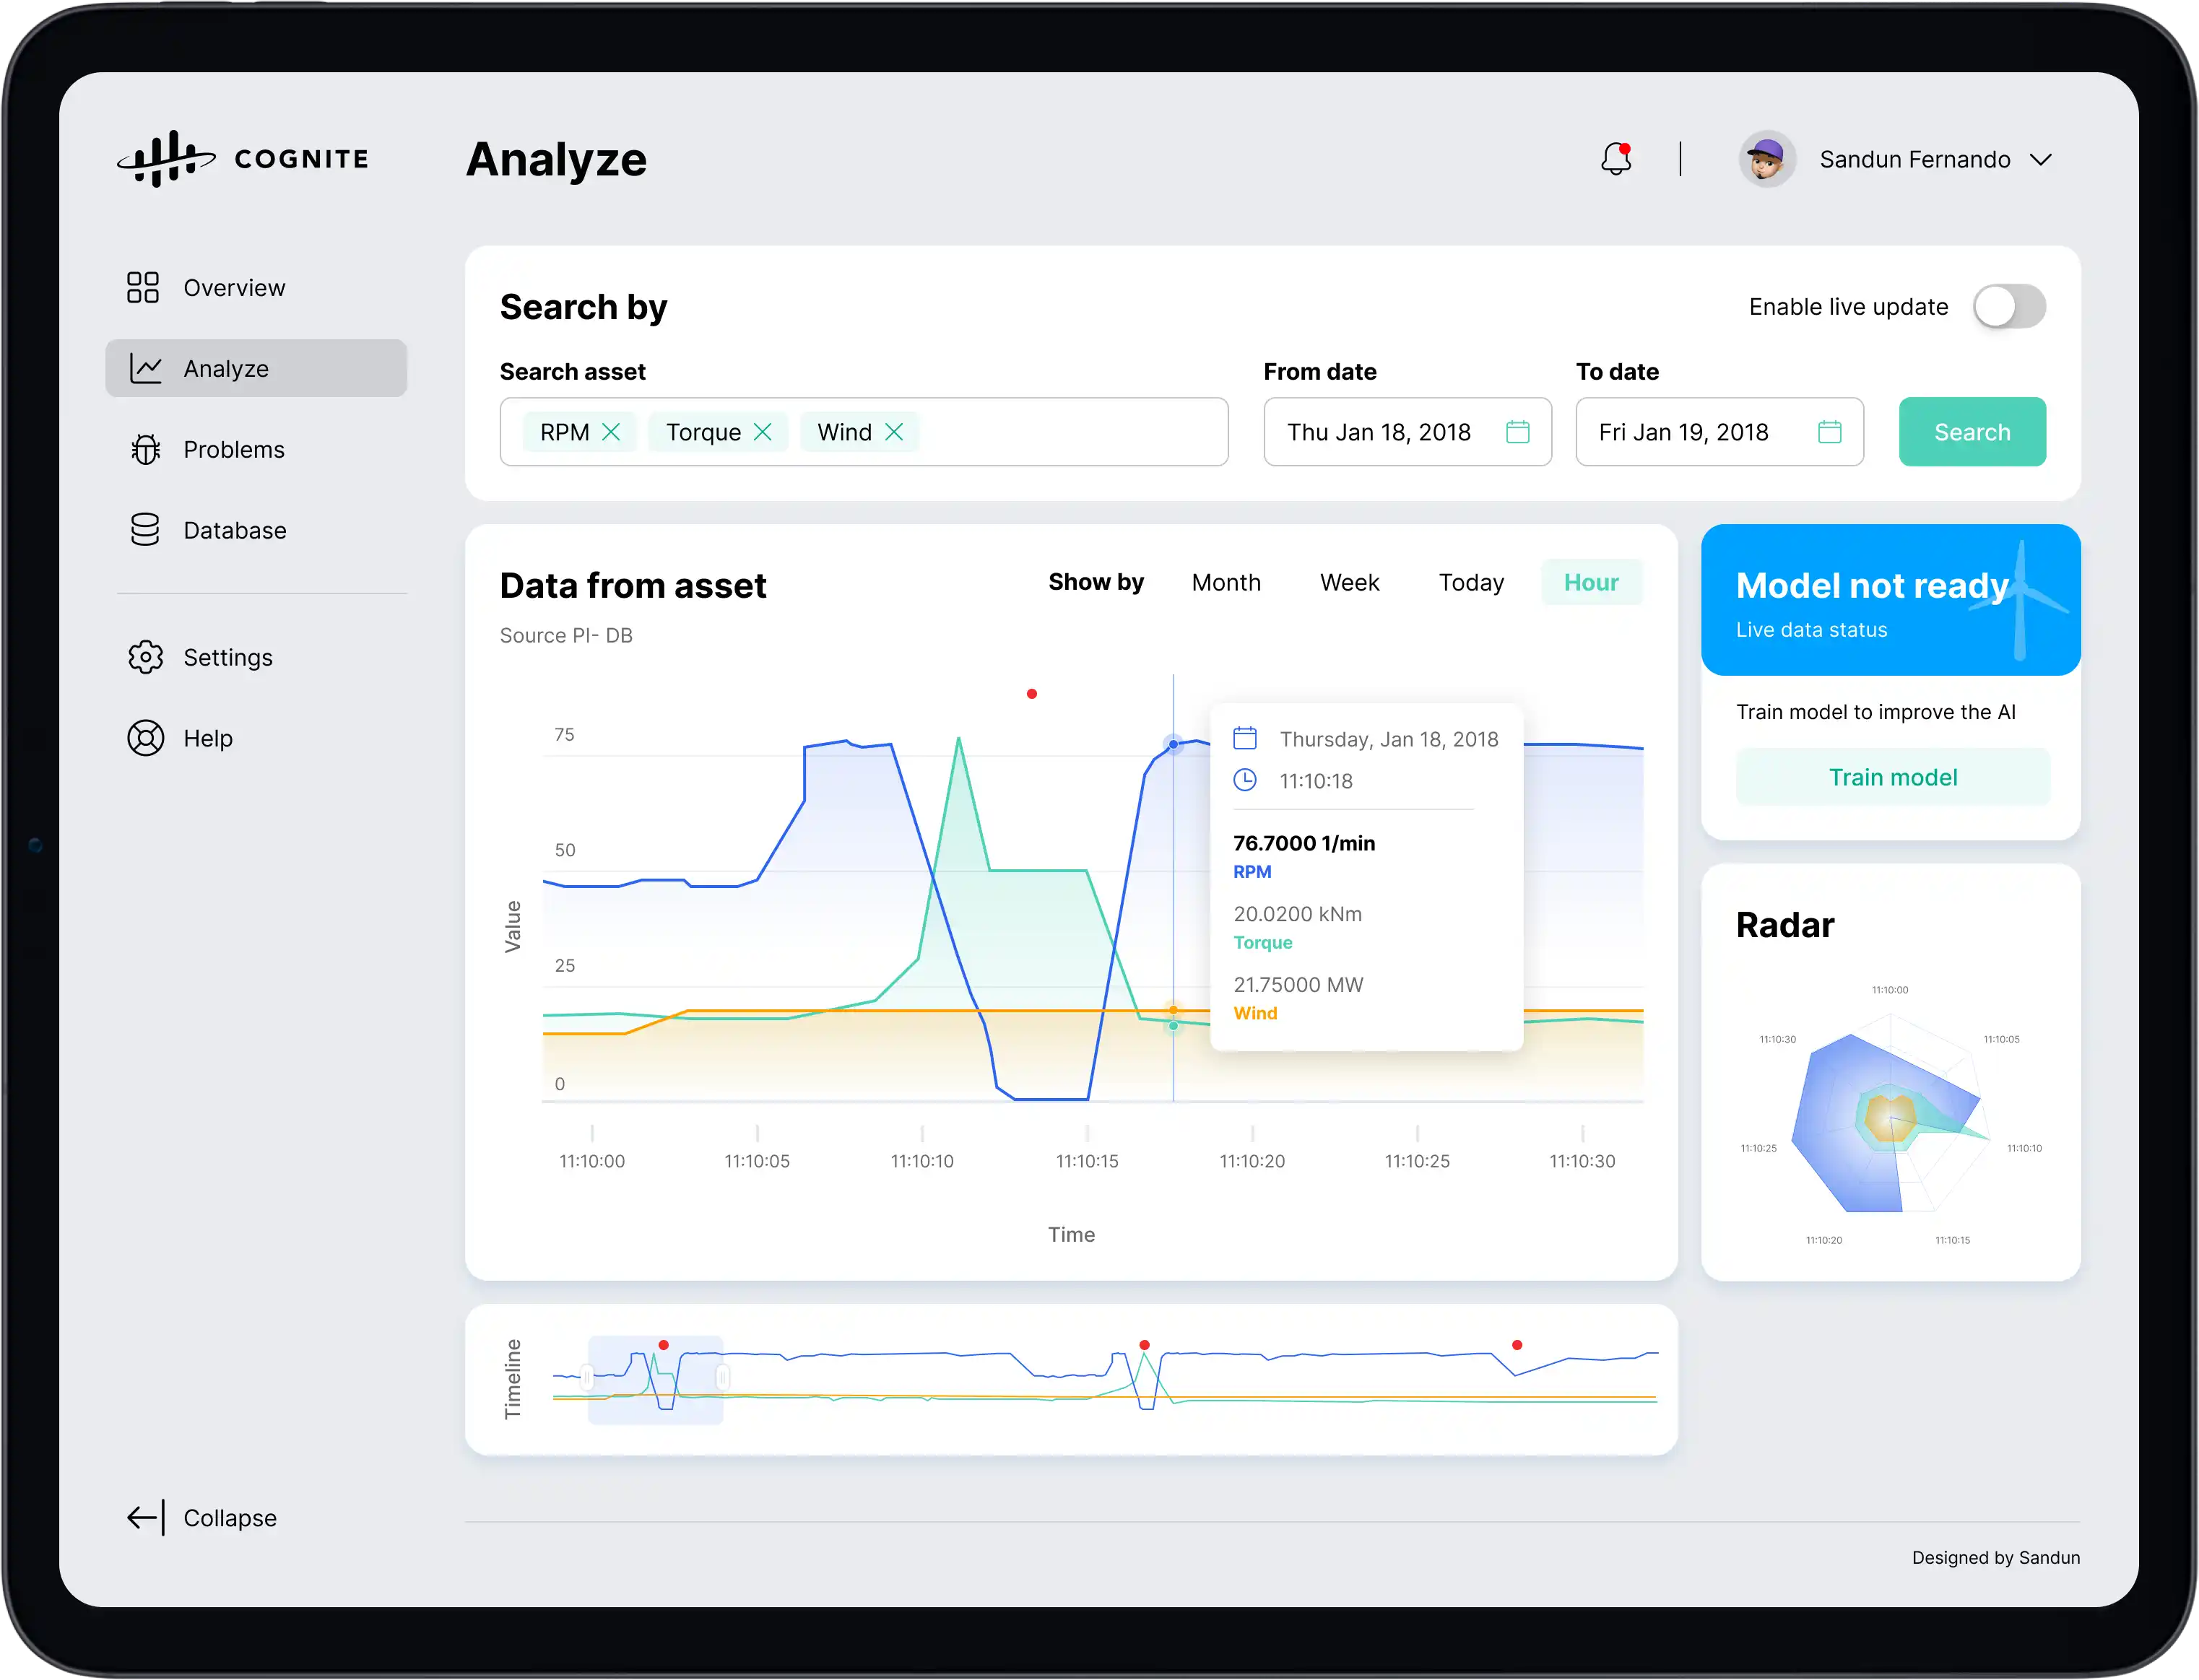
Individual Turbine Manual Analysis Hover on Chart
Interactive data visualization enabling precise cursor tracking on time-series graphs to inspect exact values and correlate anomalies with specific timestamps.
Individual Turbine Manual Analysis Take Action
Direct action interface for maintenance teams to schedule repairs, order parts, or trigger emergency protocols directly from the analysis dashboard.

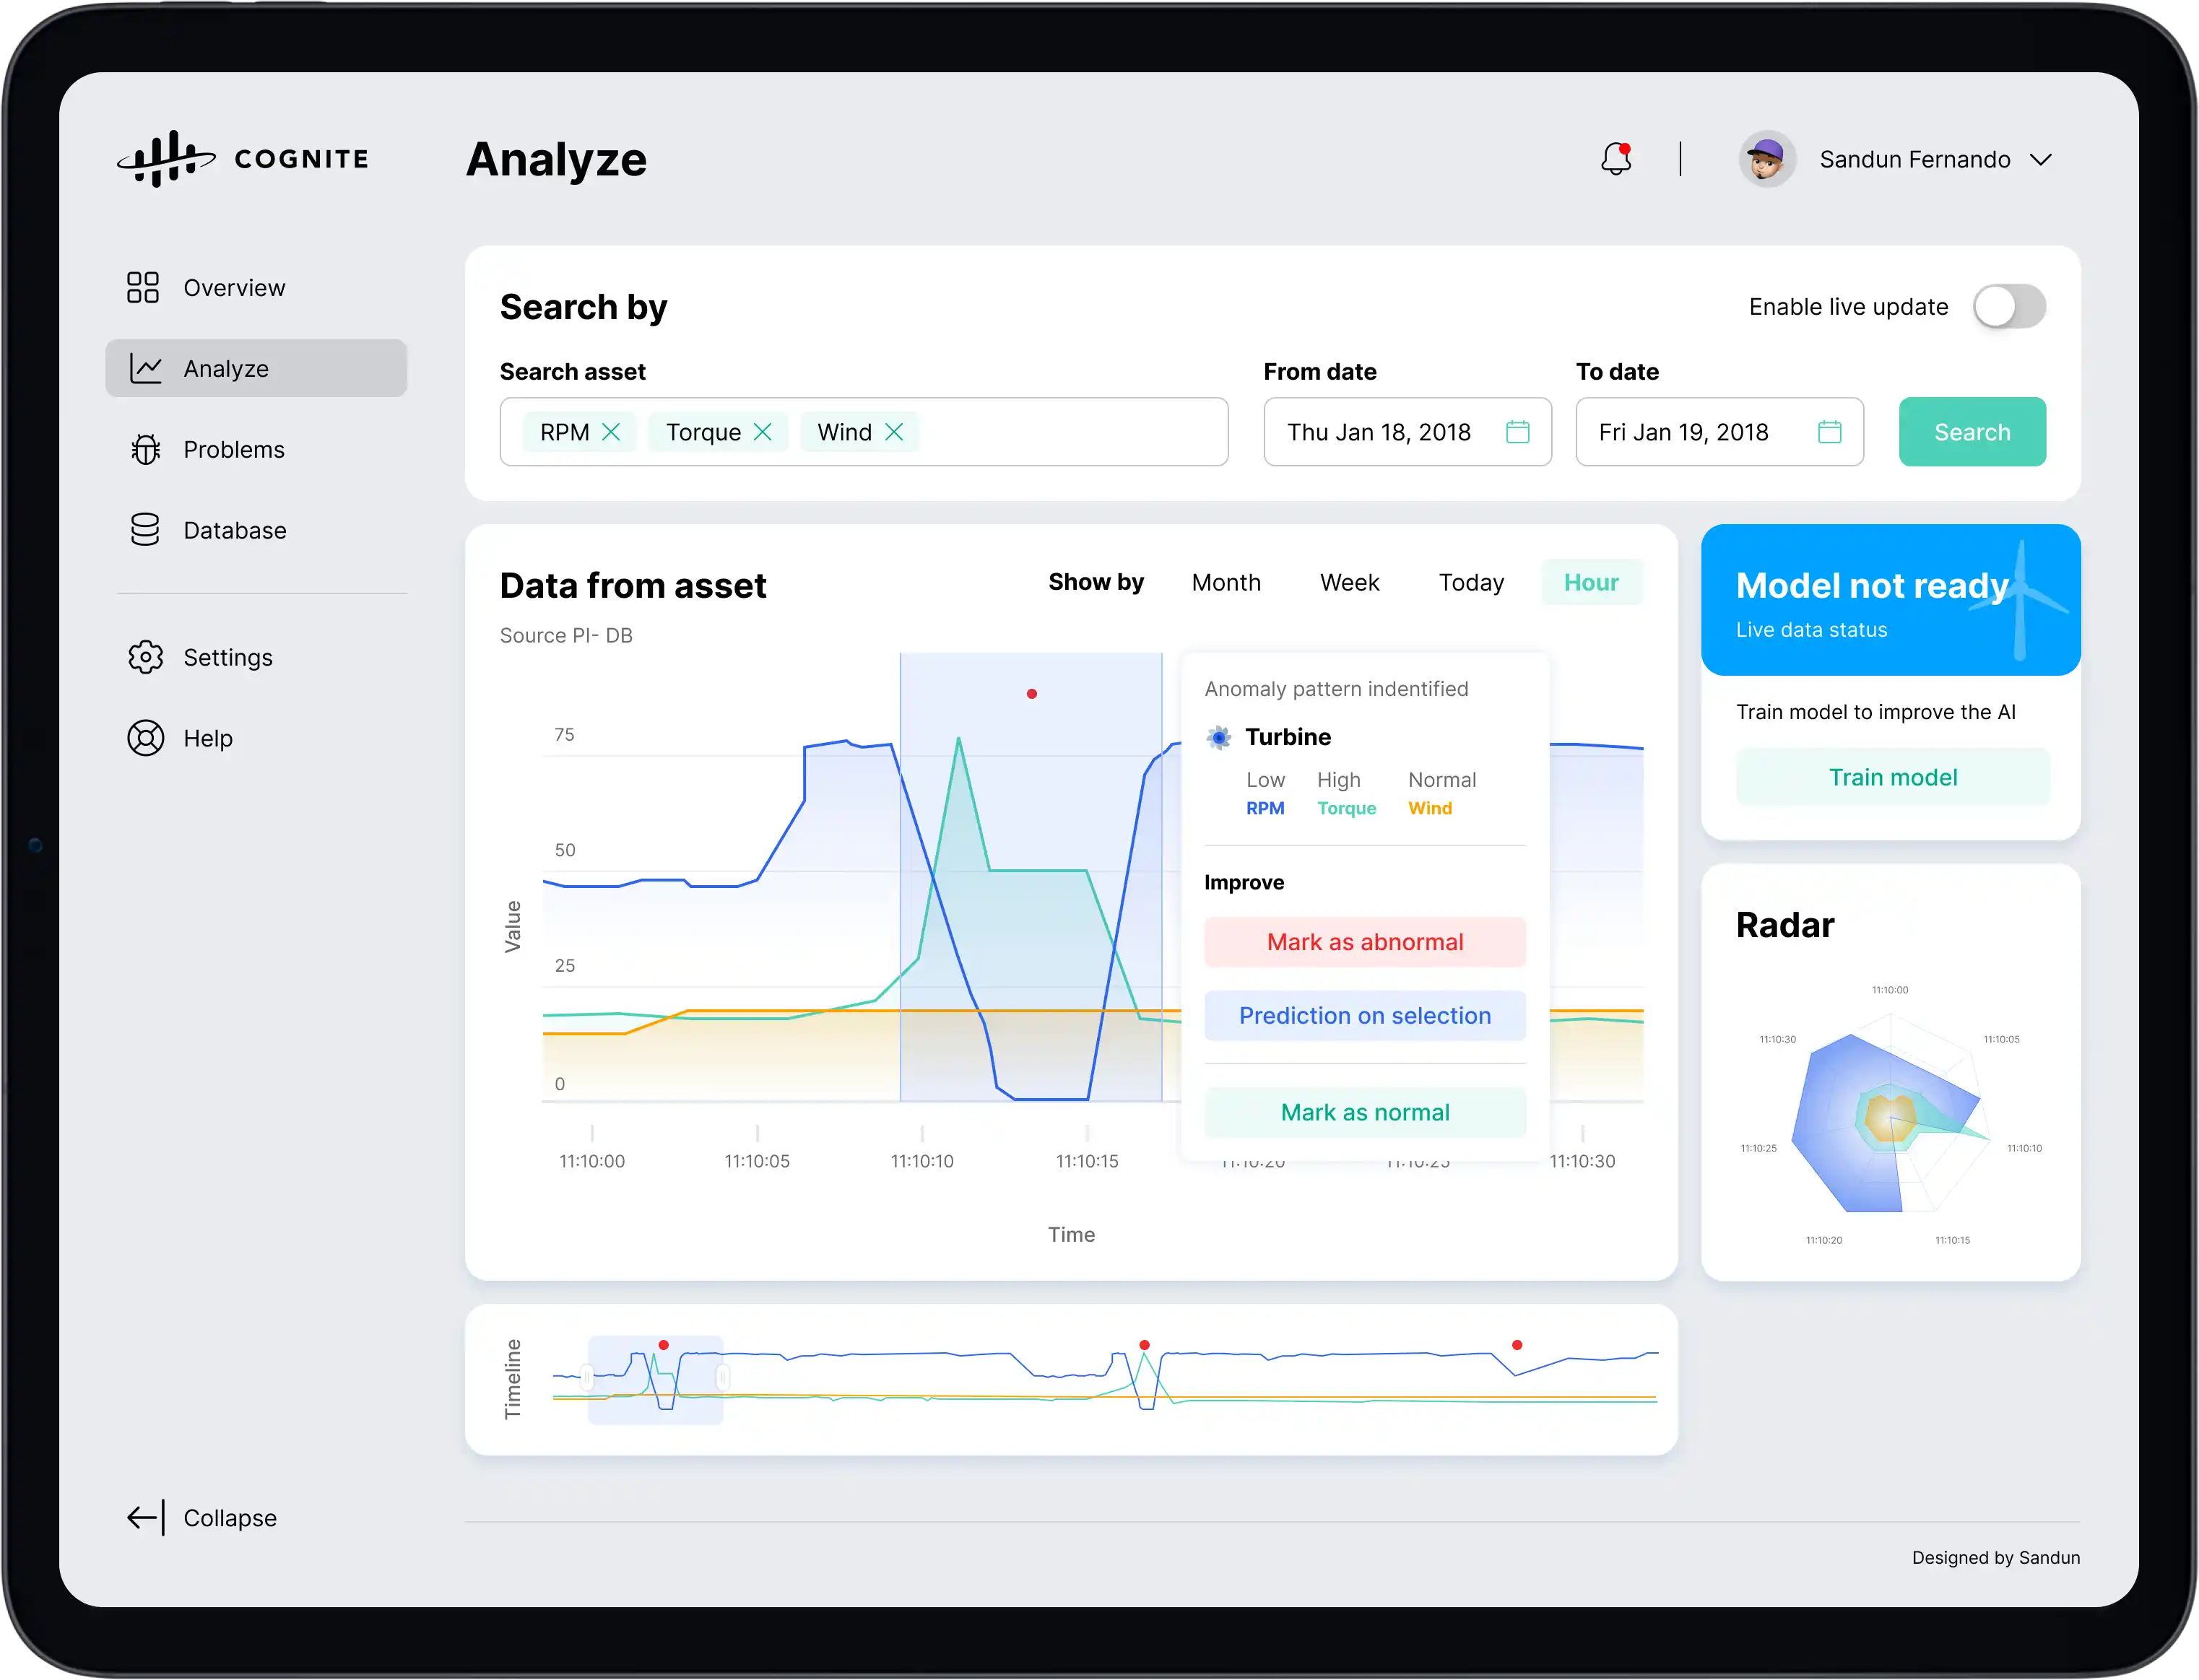
Individual Turbine Manual Analysis Anomaly Classification
A feedback loop interface where experts classify detected anomalies, enriching the training dataset and improving the model's future accuracy.
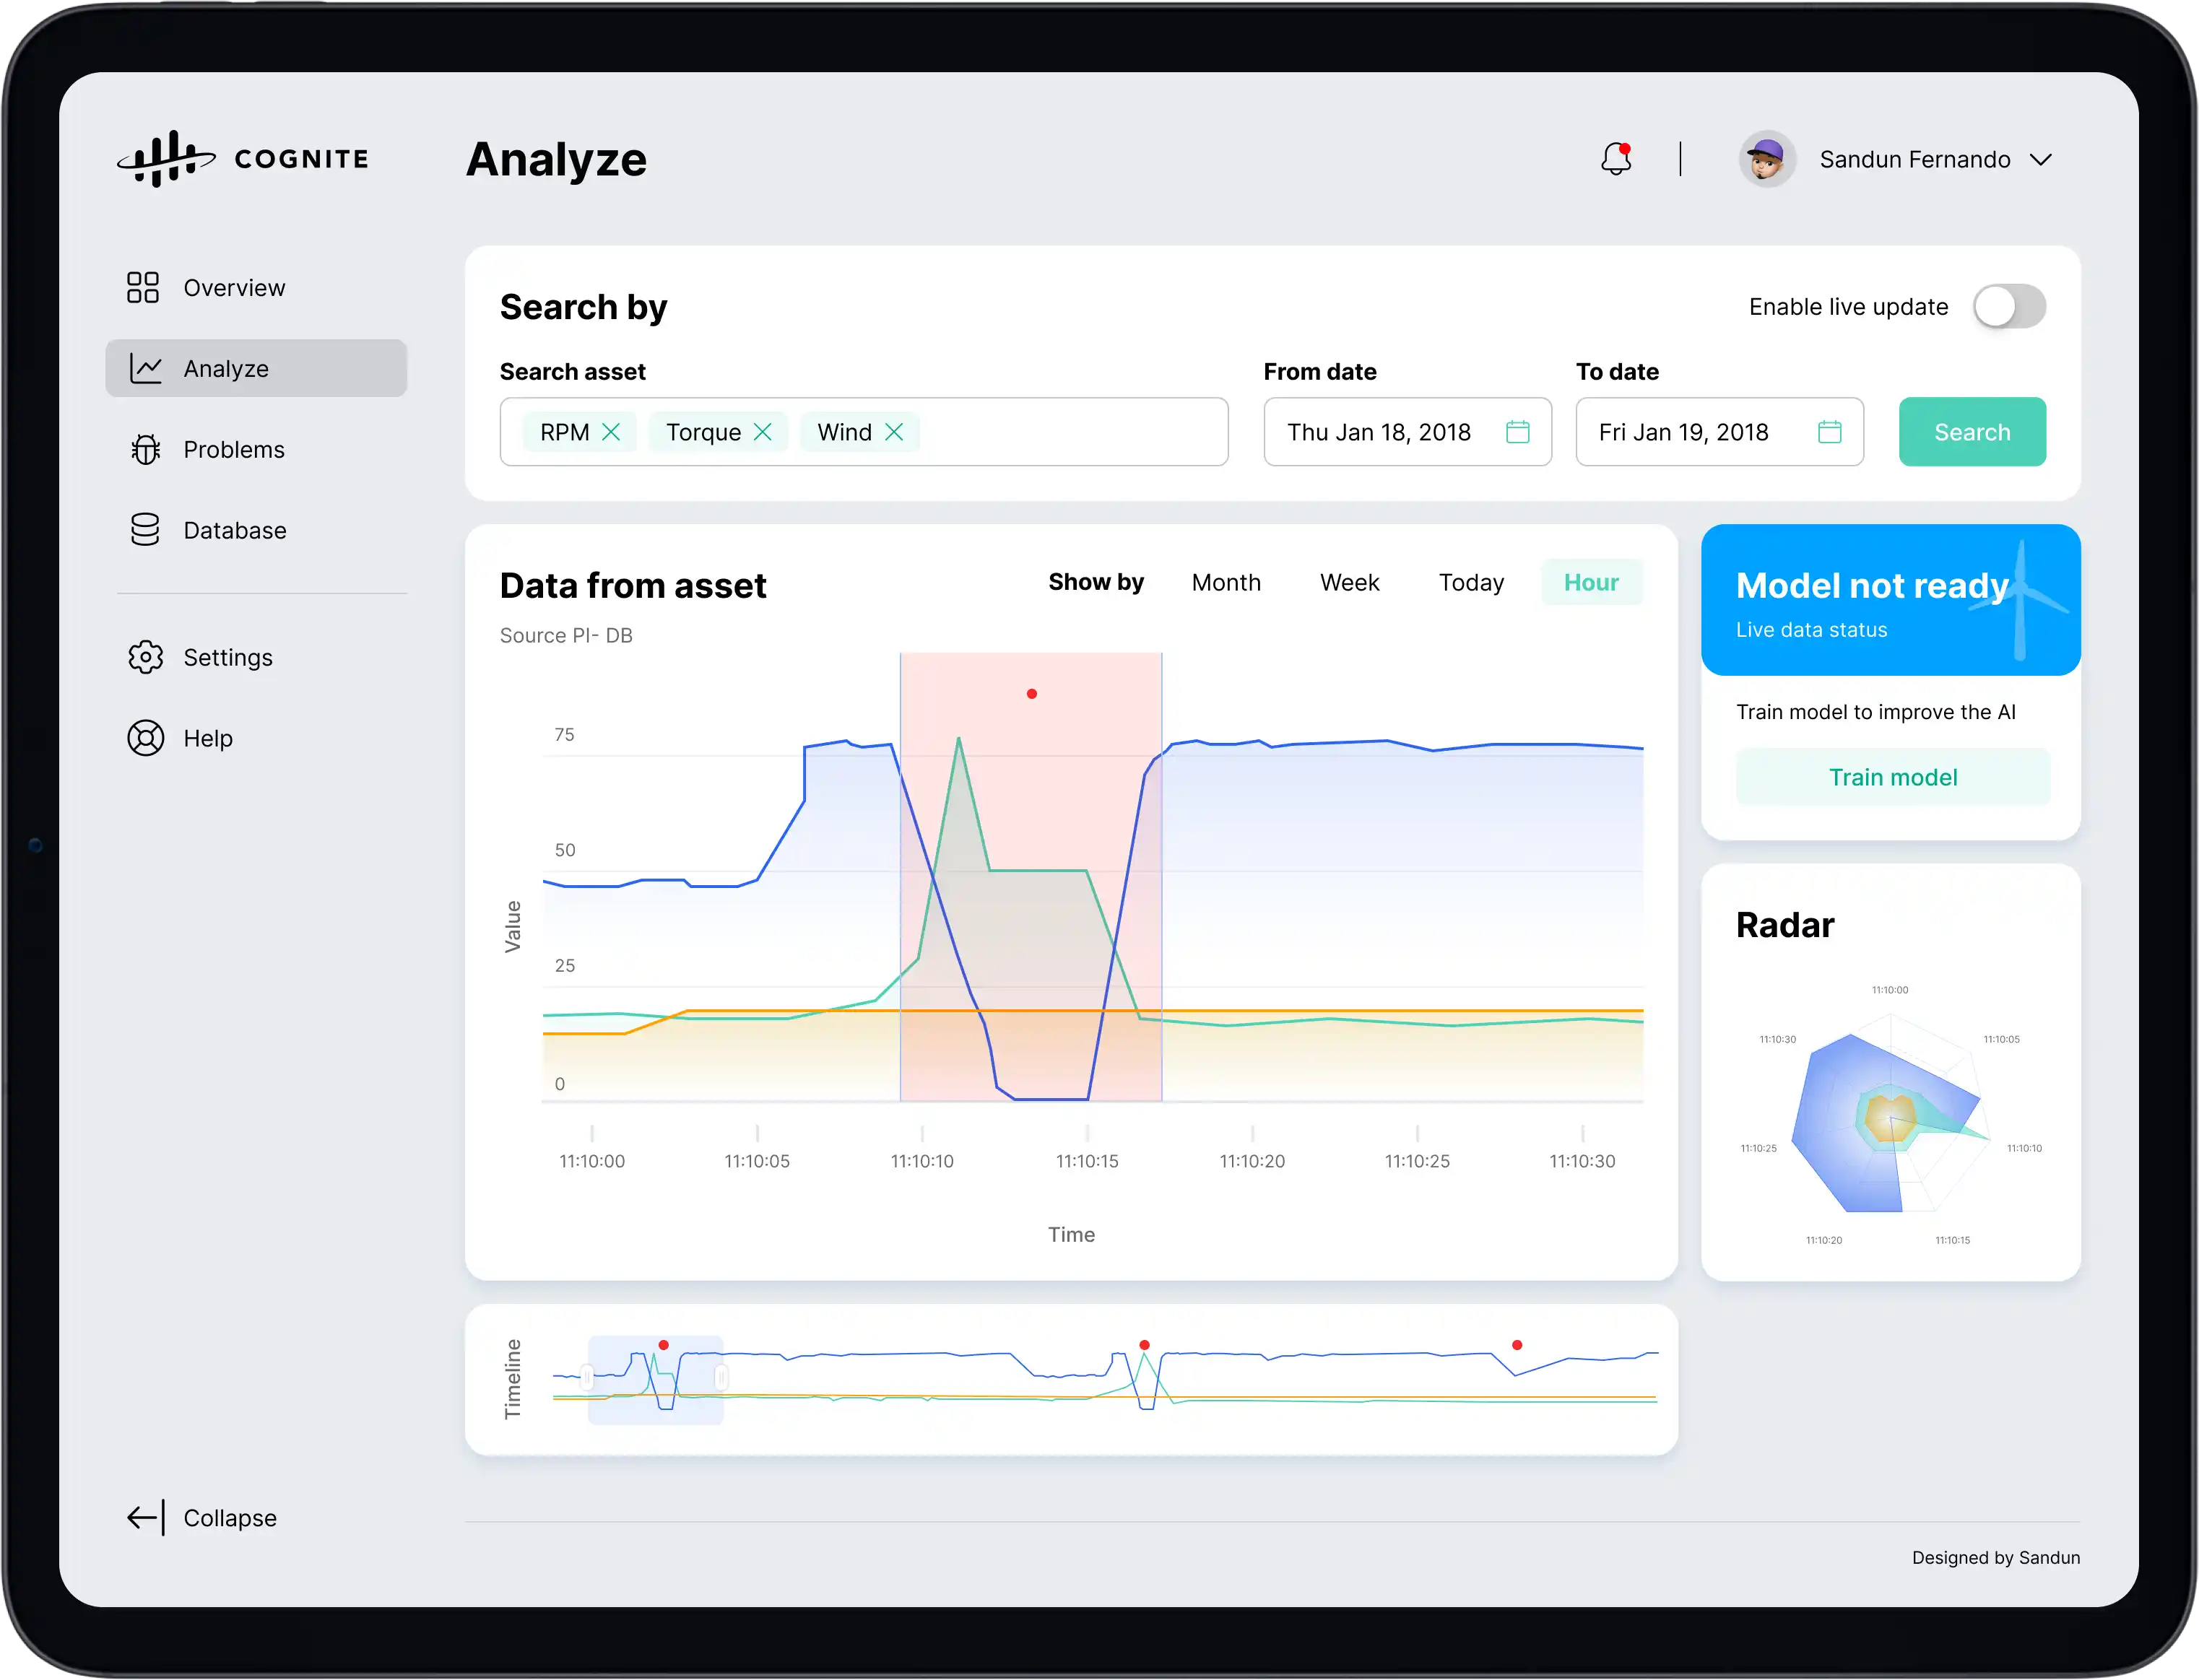
Individual Turbine Manual Analysis Marked
Visual confirmation of user-validated anomalies, creating a clear audit trail of human-ai collaboration and decision making.
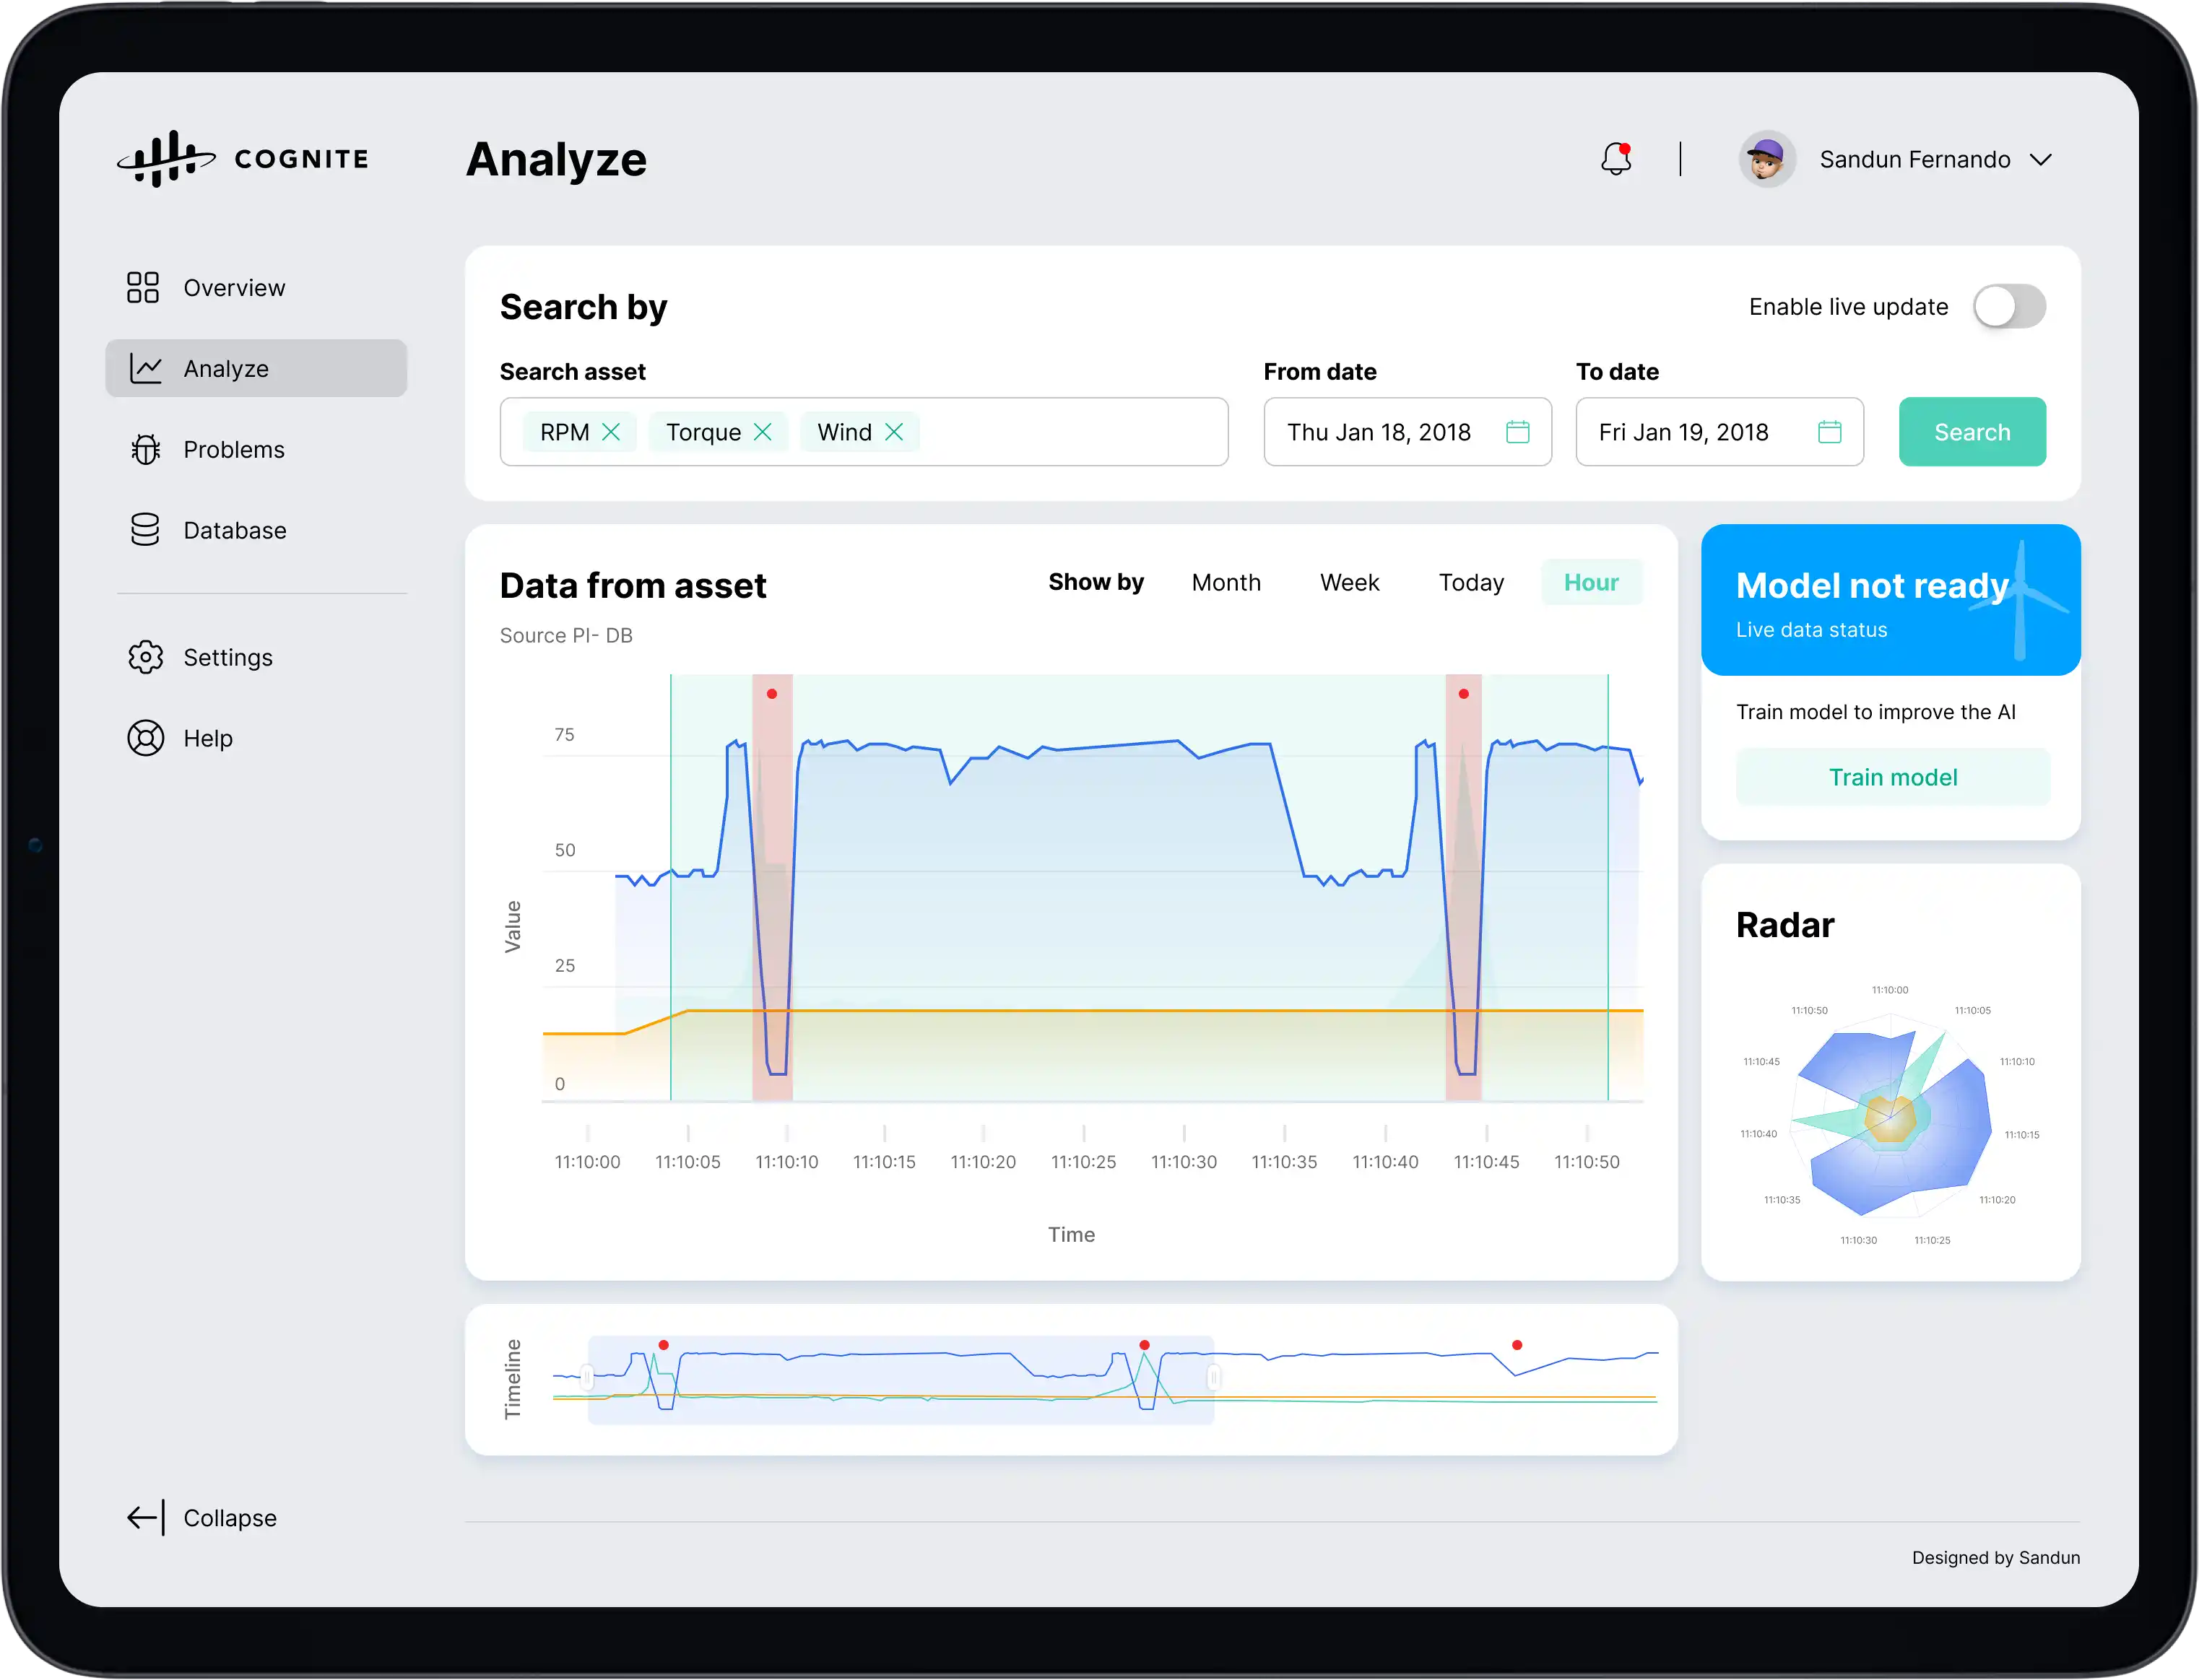
Individual Turbine Manual Analysis Model Trained
Post-training verification view showing how the updated model interprets historical data with improved precision and reduced false positives.
Conclusion
Through the cycle of detection, correction, and reinforcement, Cogn8 has laid the foundation for a self-aware AI. This intelligent system not only identifies anomalies but reflects on its own performance, improving over time and empowering the workforce to act with unprecedented confidence.
Project Summary
Implementation Lessons
Adopting AI-driven observability is a journey. Here are the key takeaways from our implementation process.
Data Quality is Paramount
AI is only as good as the data it's fed. Ensuring full stack coverage with unified data collection was critical for accurate root cause analysis.
Culture Shift Required
Moving from reactive firefighting to proactive optimization requires a mindset shift. Trusting the AI's answers took time but paid off.
Automation is the Goal
Observability without automation is just noise. Connecting Causal AI to remediation workflows for auto-remediation was the game changer.
Security at Speed
Integrating App Security into the observability platform allowed us to detect vulnerabilities in runtime without slowing down releases.