Modernising a Legacy Banking Portal for 120M+ Users
A consulting engagement on the Backbase platform restructuring information architecture, rebuilding trust through design consistency, and reducing the operational cost of avoidable support calls.
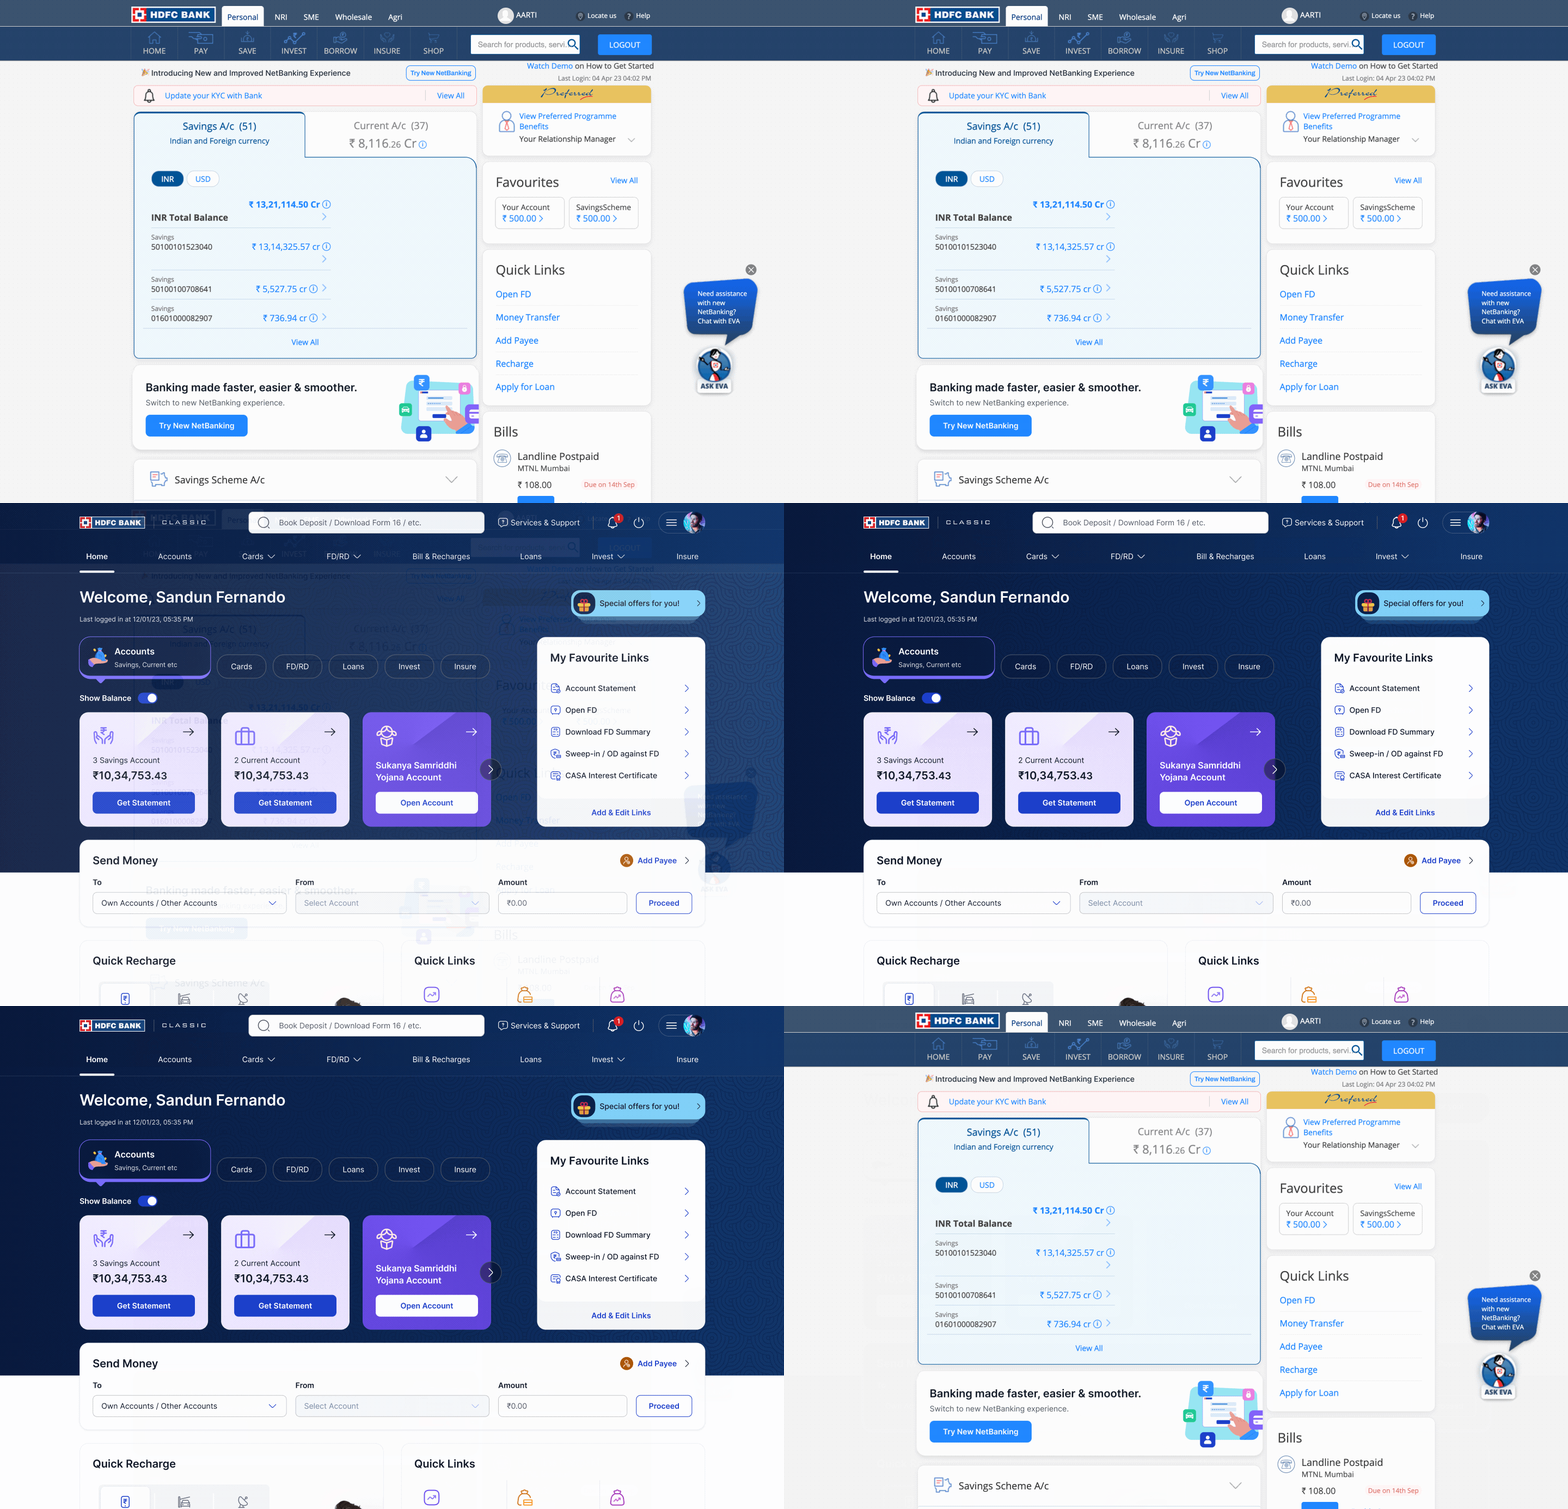
The redesigned portal homepage surfacing the tasks users need most, in the moment they need them.
The brief was to "modernise the UI." The real problem was deeper.
HDFC's portal was built over a decade, shaped by internal org charts rather than user needs. This led to:
- Rising support calls because users couldn't find critical features (e.g., "Block Card" took 4+ clicks).
- Confusing navigation buried under internal banking acronyms.
- Eroding trust due to an outdated, visually fragmented interface.
My role was to push this Backbase platform engagement past a surface-level visual refresh into a full structural redesign - scaling across 120 million customers while respecting strict engineering constraints.
What I owned on this project
I joined as Lead Product Designer on a consulting engagement, embedded with the client's product and technology teams. I was responsible for the end-to-end UX from discovery through to prototyping and stakeholder sign-off.
Research & Discovery
Heuristic analysis, ROT audit, NLP sentiment parsing of 500+ App Store reviews, 15 user interviews across demographic segments
Information Architecture
Card sorting (unmoderated), tree testing, IA restructure, sitemap, content hierarchy definition
Design System
Token-based design system aligned with Backbase component architecture colour, typography, spacing, and interactive states
Stakeholder Alignment
Impact/Effort prioritisation workshops, service blueprint to justify operational cost savings, executive-ready prototype walk-throughs
Three compounding failures making users call support
Users couldn't complete critical tasks independently
High-value, low-frequency tasks blocking a lost card, downloading a tax certificate, transferring via RTGS were buried 4 to 6 navigation levels deep. Users in urgent situations couldn't find what they needed, so they called support instead. Analysis of 500+ support tickets showed that a significant share of inbound calls were for tasks that the portal was already capable of handling.
Evidence: Support ticket analysis + moderated usability sessions (n=15) where users failed to locate "Block Card" within 3 minutes.
The information architecture was organised around the bank's internal structure, not user needs
Navigation menus reflected the bank's internal department names, not how customers described their own tasks. "RTGS/NEFT" meant nothing to a user who just wanted to "send money to another bank." Features were grouped by product team ownership, not by the user's goal. Card sorting sessions with 12 participants revealed that users had fundamentally different mental models from the current navigation hierarchy.
Evidence: Unmoderated card sorting (n=12), tree testing, NLP analysis of 500+ App Store reviews surfacing "can't find" as the most common complaint cluster.
Outdated visual design was eroding trust, particularly with younger users
NLP sentiment analysis of App Store reviews showed a recurring pattern: younger users equated the aged UI with poor security and broken functionality. One phrase appeared repeatedly, "looks like it hasn't been updated since 2010, doesn't feel safe to use." This wasn't a cosmetic problem. It was a trust deficit that was affecting engagement and retention.
Evidence: NLP sentiment analysis of 500+ App Store reviews, "trust" and "looks outdated" as co-occurring negative sentiment clusters.
How might we redesign a banking portal serving 120 million users so that anyone regardless of digital literacy, can complete a high-stress financial task in seconds, not minutes, without picking up the phone?
If we restructure the IA around user mental models, not internal org charts, elevate emergency tasks to the first level of navigation, and establish a consistent token-based design system, then we will reduce time-on-task for critical flows from minutes to seconds and measurably reduce avoidable support call volume.
Building the evidence before touching a single pixel
Before any design work began, I ran a multi-method discovery phase. The goal was to quantify the usability problems, understand user mental models, and build an evidence base strong enough to justify a full structural redesign not just a visual refresh.
Heuristic Analysis
Evaluated the existing portal against Nielsen's 10 heuristics. Identified 23 critical violations primarily around error prevention, recognition over recall, and consistency.
ROT Content Audit
Catalogued every feature against Redundant / Outdated / Trivial criteria. 34% of top-level menu items were surfacing features used by under 3% of users monthly.
NLP Sentiment Analysis
Parsed 500+ App Store reviews using NLP clustering. "Can't find," "confusing navigation," and "looks outdated/unsafe" emerged as the three dominant negative sentiment clusters.
User Interviews · n=15
15 moderated sessions across age groups and account types. Task-based format: "You've just lost your card. Block it." Observed failure patterns and emotional responses in real time.
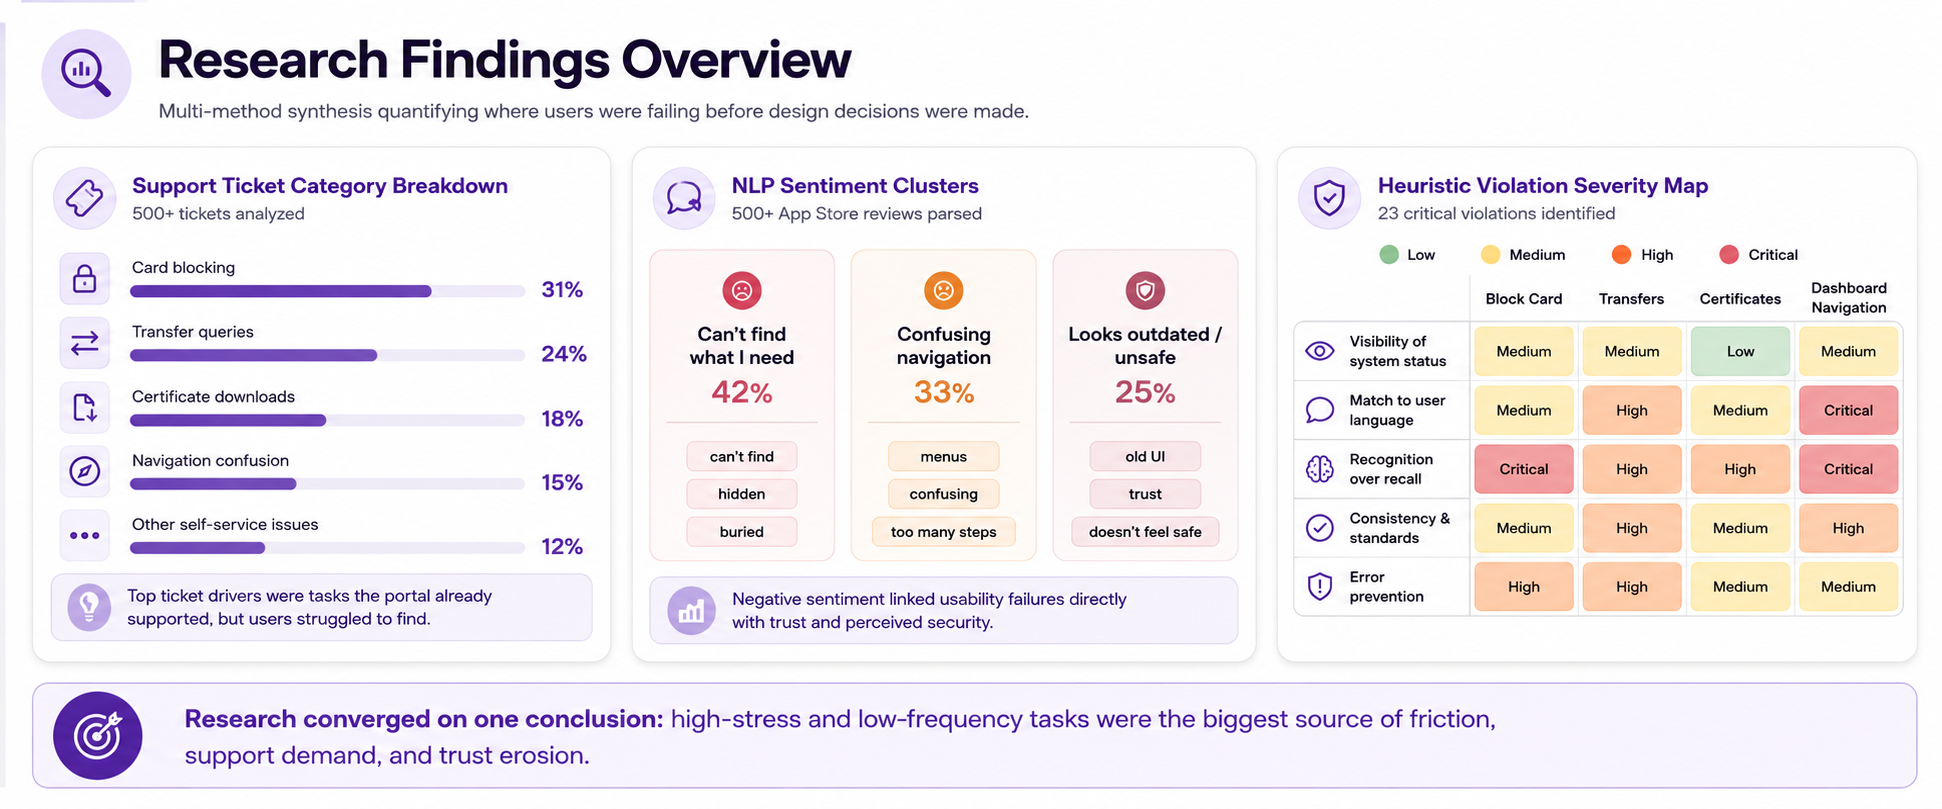
Multi-method research synthesis quantifying where users were failing before any design decisions were made.
What the research told us that changed the direction
Support tickets are the real usability report
Analysing 500+ tickets provided quantitative proof of failure points. The top 3 categories - card blocking, transfer queries, and certificate downloads - became our primary redesign targets.
Users grouped features by goal, not by product category
Card sorting proved users grouped 'Mobile Recharge' and 'FASTag' as 'top-up tasks' - a category missing from the old IA. This validated a new cross-product 'Quick Actions' hub.
Emergency tasks need a different design contract entirely
In a panic, users don't browse; they scan desperately. Placing 'Block Card' inside a nested submenu was a category error. Emergency functions needed permanent root-level placement.
The rules we designed by, and why
Derived from card sorting data showing users organise by task type, not product category.
Navigation rebuilt around user intents: Send, Receive, Pay, Protect, Access.
Derived from observing users fail to locate "Block Card" under time pressure consistently triggering a call to support.
"Urgent Actions" module permanently surfaced on root dashboard.
Derived from heuristic analysis showing 34% of top-level menu items were for features used by <3% of users.
Secondary features collapsed by default, surfaced on demand with contextual logic.
Derived from NLP analysis showing visual inconsistency was interpreted by users as a sign of poor security and neglect.
Token-based design system enforcing consistent colour, type, and spacing across all modules.
Derived from the reality that a 120M+ user base includes millions of elderly and visually impaired users.
Enforced strict WCAG AA+ contrast ratios, scalable typography, and full keyboard navigation for power users and screen readers.
How we got from insight to structure
We ran two structured ideation phases before committing to any high-fidelity design. The goal was to explore structural options, not visual polish and validate them with real users before investing in execution.
Card Sorting → Sitemap → Tree Testing
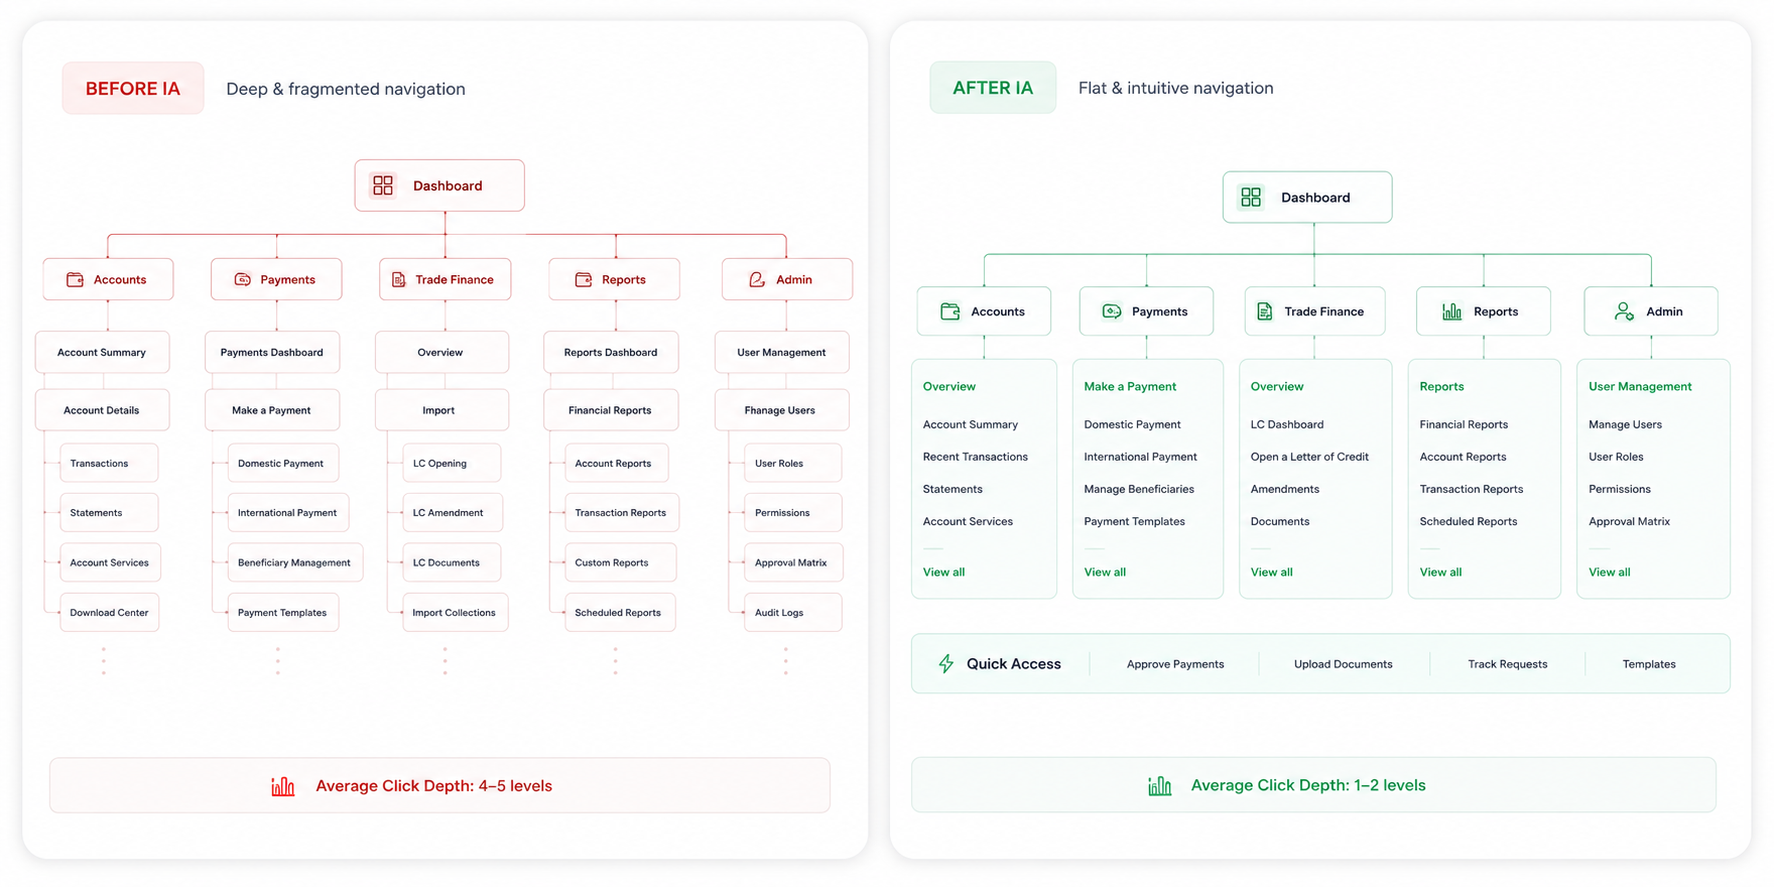
Before sketching anything, we ran unmoderated card sorting to build the new IA from user behaviour data. The proposed sitemap was then validated through tree testing measuring first-click accuracy and time-to-target on critical tasks.
Card Sorting Output
Tree Testing
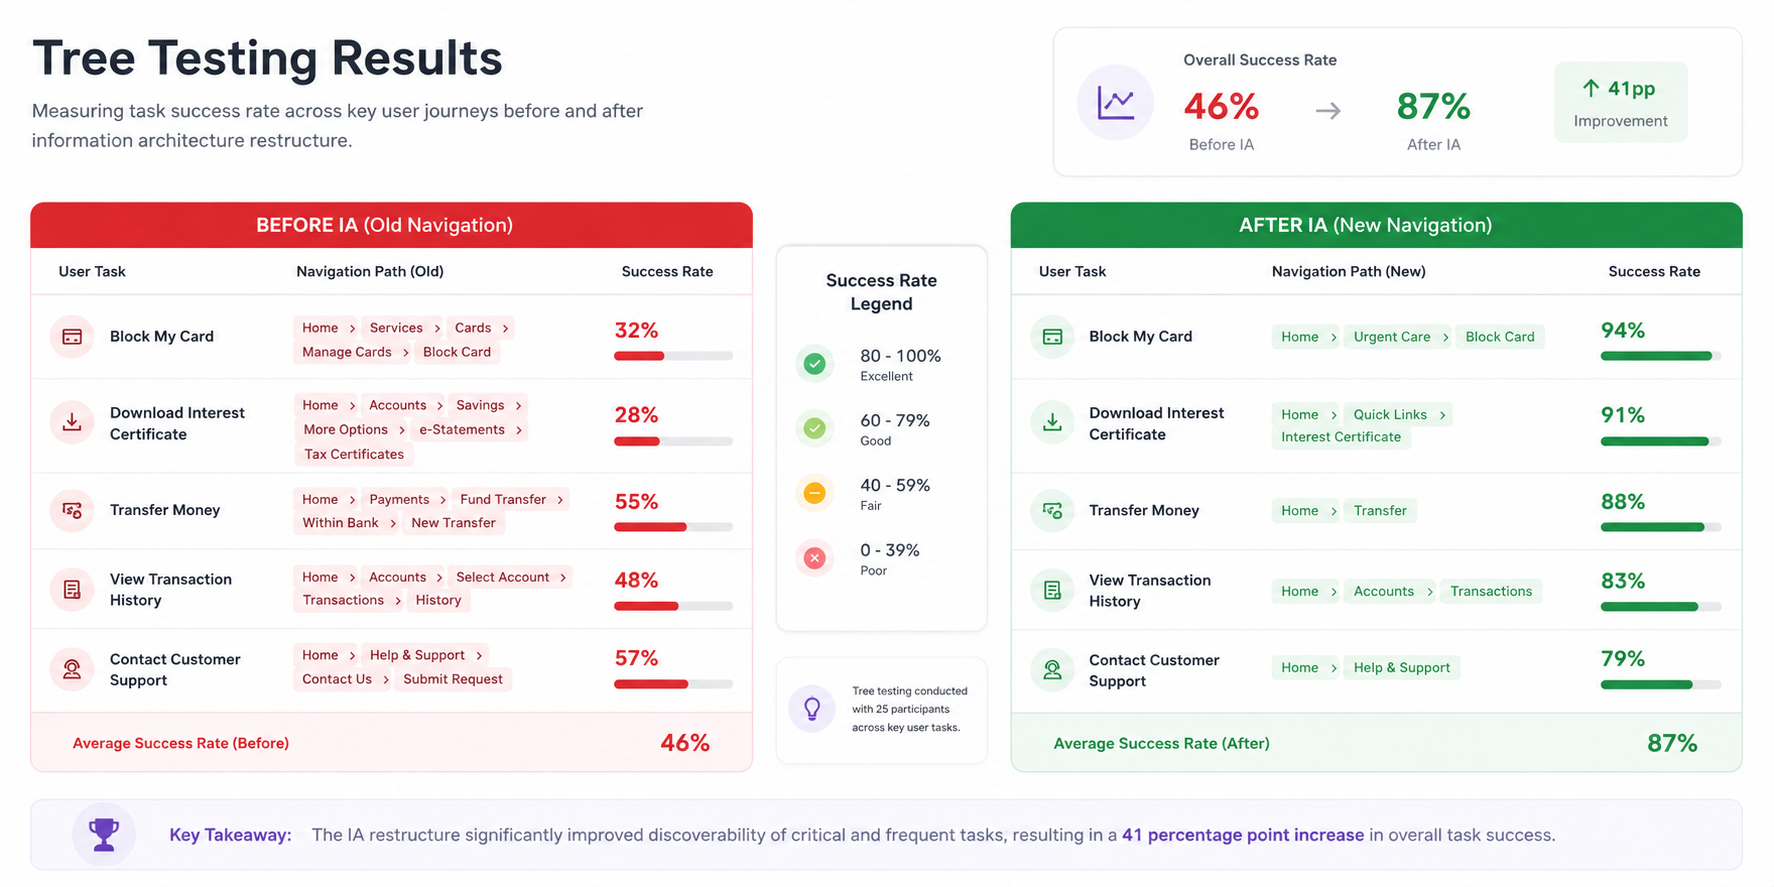
Card sorting output informed the new navigation structure. Tree testing validated it with a 78% first-click success rate on critical tasks (vs. 42% on the original structure).
Crazy 8s Workshops → Prioritisation Matrix
We ran Crazy 8s sessions with PMs and engineers to generate layout concepts rapidly without default assumptions. Outputs were then mapped on an Impact vs. Effort matrix to define Q1 scope vs. phased roadmap.
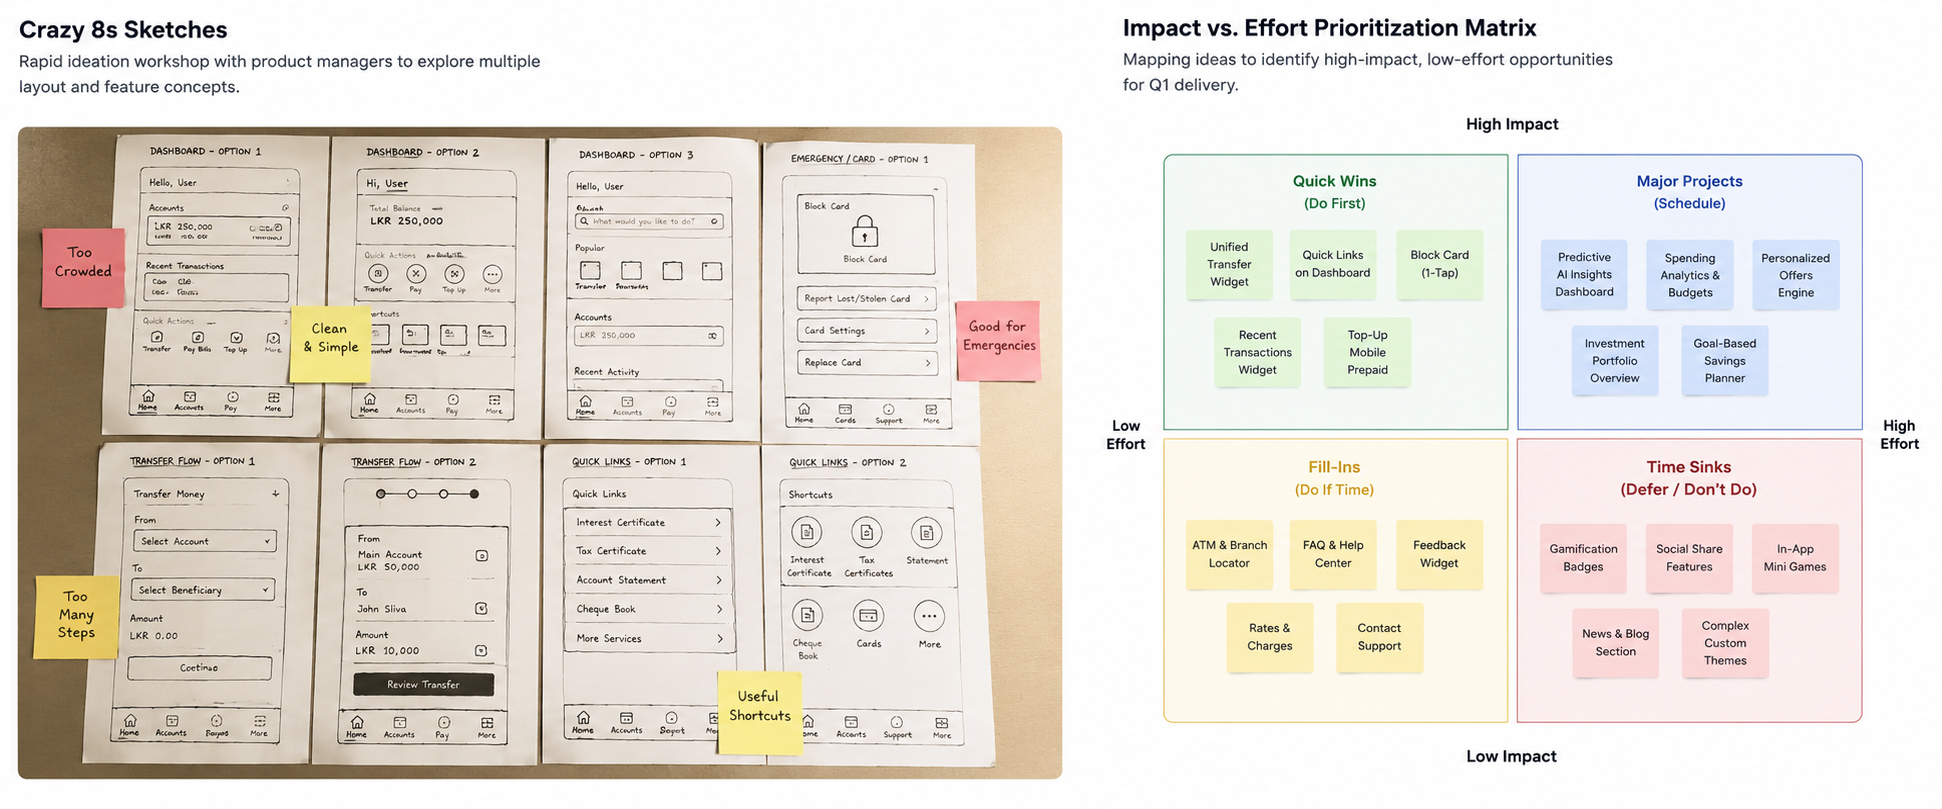
Crazy 8s output rapid ideation session with PMs. The prioritisation matrix separated Q1 delivery (Unified Transfer Widget, Emergency Actions) from phased roadmap items (AI Recommendations, Predictive Dashboard).
Flattening the "Block Card" Flow
We mapped the "Messy Middle" of the legacy flow. To block a card previously took 4 navigation steps and 2 confirmation screens. We redesigned the logic tree to expose it as a 1-click action from the dashboard, dramatically reducing time-on-task during high-stress scenarios.
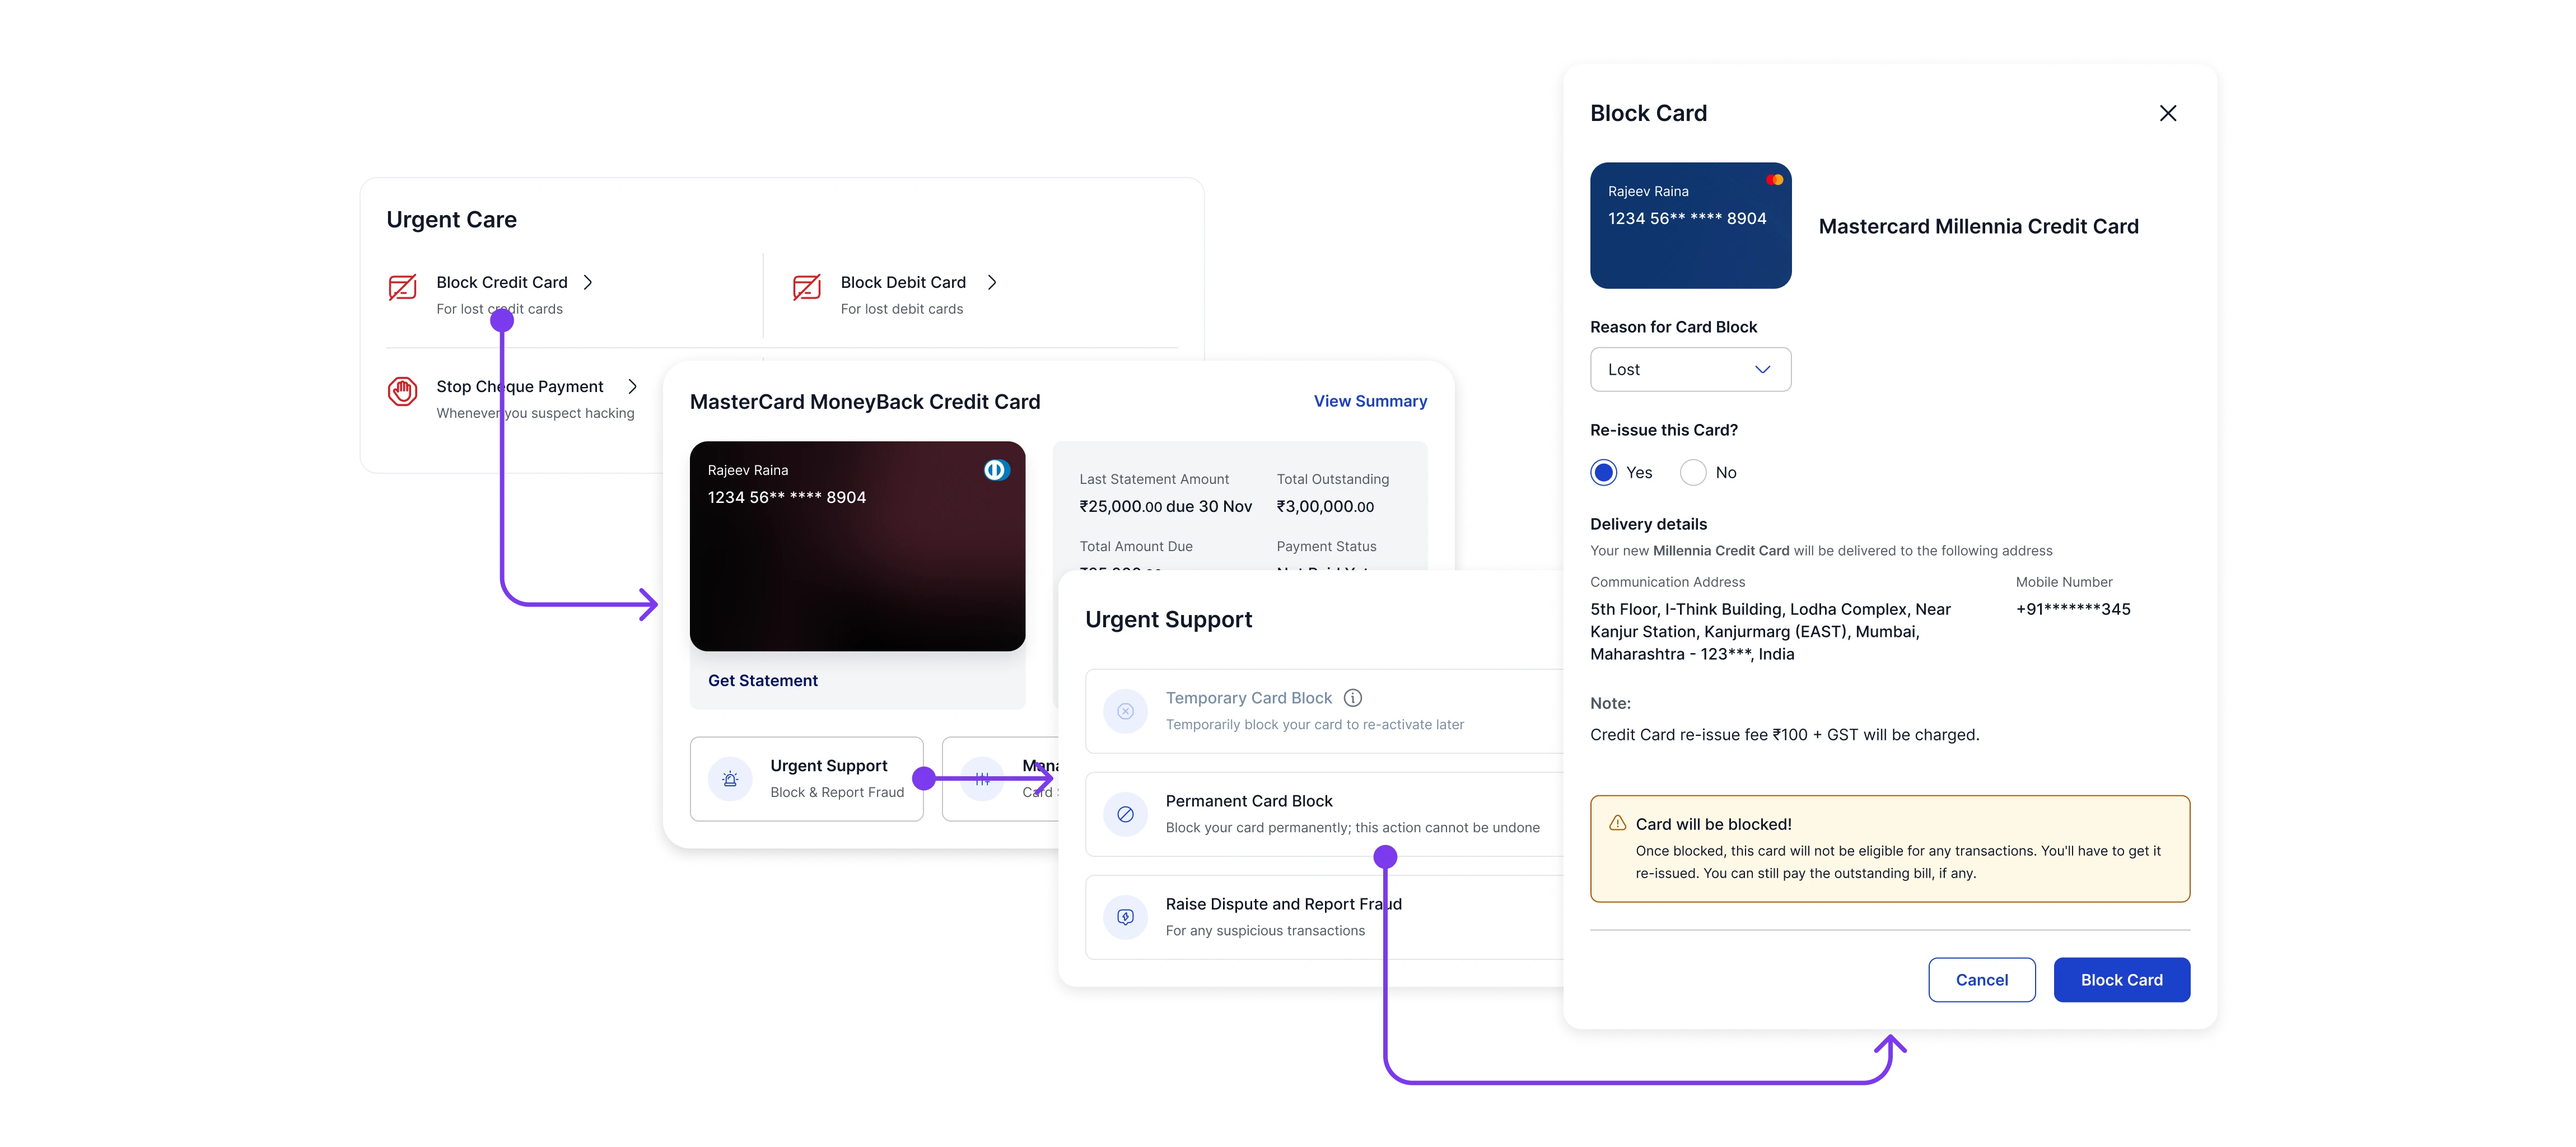
The new mental model for emergency actions.
Service Blueprint → Prototype → Usability Validation
Low-fidelity wireframes were tested iteratively before high-fidelity execution. A service blueprint mapped every front-stage design decision against back-stage API constraints making the operational cost case visible to stakeholders.
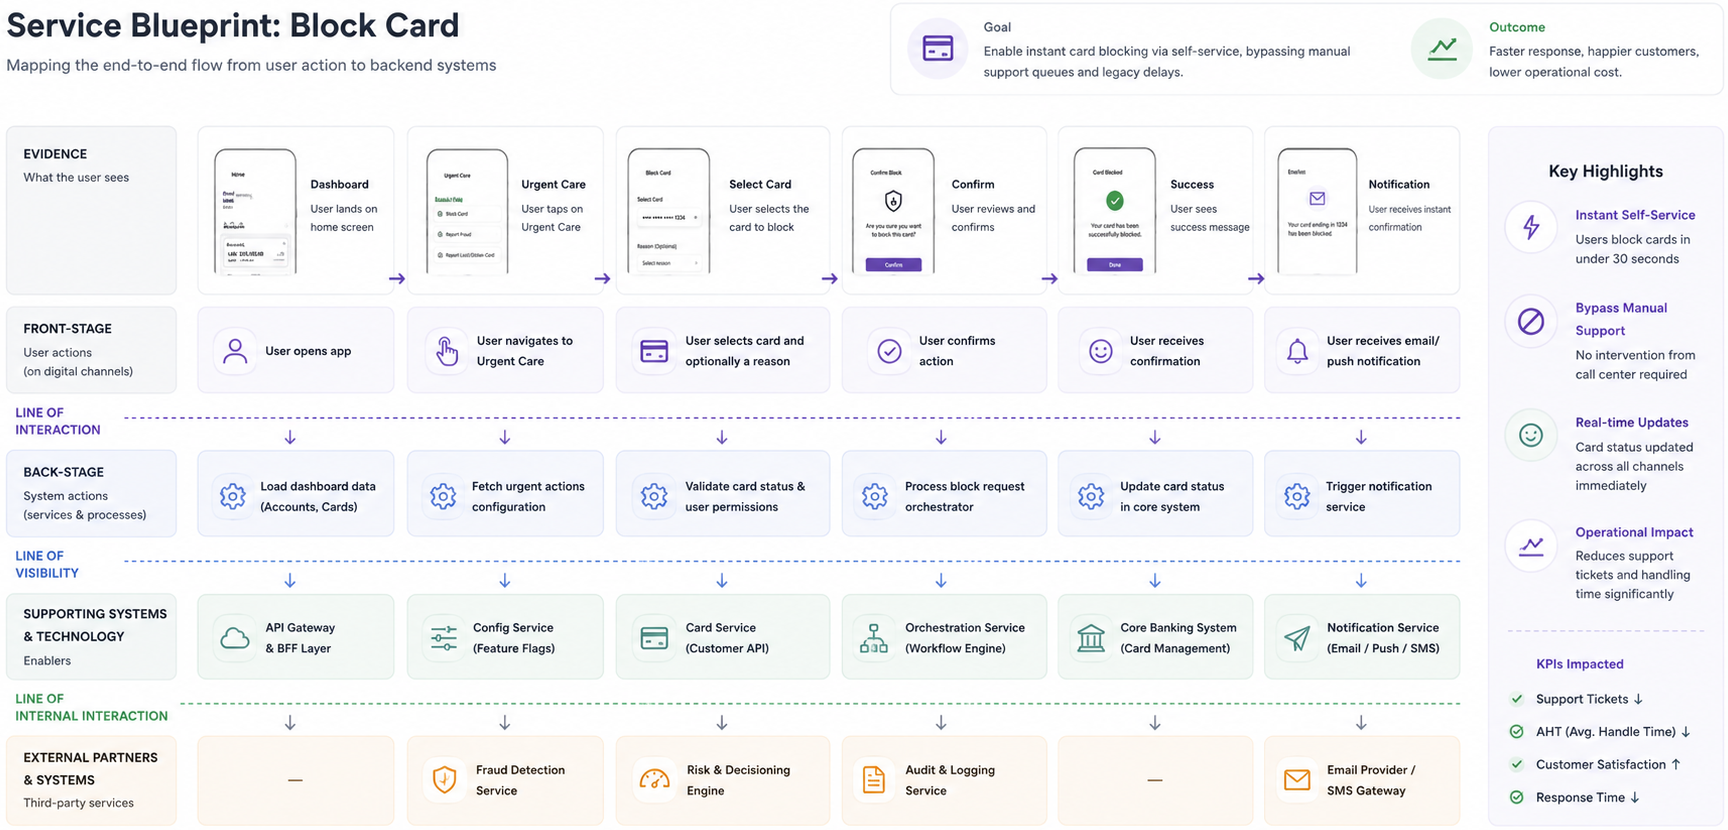
The service blueprint made the "20% operational cost reduction" case tangible for stakeholders showing exactly which support call types would be eliminated by self-service flows.
The choices that shaped the outcome
Decision 01
Full IA restructure vs visual refresh only
Tension
Stakeholders initially wanted a UI polish. A full IA restructure meant more engineering effort and more risk.
Choice
We pushed for structural redesign, backed by ticket data and tree testing results.
Trade-off
Longer timeline.
Outcome
The redesign addressed root cause, not symptom.
Decision 02
Persistent "Urgent Actions" vs a smart contextual assistant
Tension
Engineering proposed a context-aware AI assistant to surface tasks dynamically. More sophisticated, but higher delivery risk and unproven for high-stress scenarios.
Choice
Shipped persistent "Urgent Actions" in Q1, deferred AI recommendations to Q3.
Trade-off
Less personalisation initially.
Outcome
Reliable, predictable experience for edge-case stress scenarios.
Decision 03
Token-based design system vs bespoke component styling
Tension
Bespoke styling per feature would have been faster for designers in the short term but unsustainable as the platform scaled.
Choice
Built a governed, token-based design system where Figma variables mapped 1:1 with Backbase's frontend architecture.
Trade-off
Created short-term overhead.
Outcome
Guaranteed long-term velocity and seamless engineering handoff across 40+ components.
The redesigned portal, built for humans under pressure
High-fidelity designs were tested in moderated usability sessions before handoff. Each screen iteration was validated against our primary success metrics: time-to-task on critical flows, and SUS score improvement.
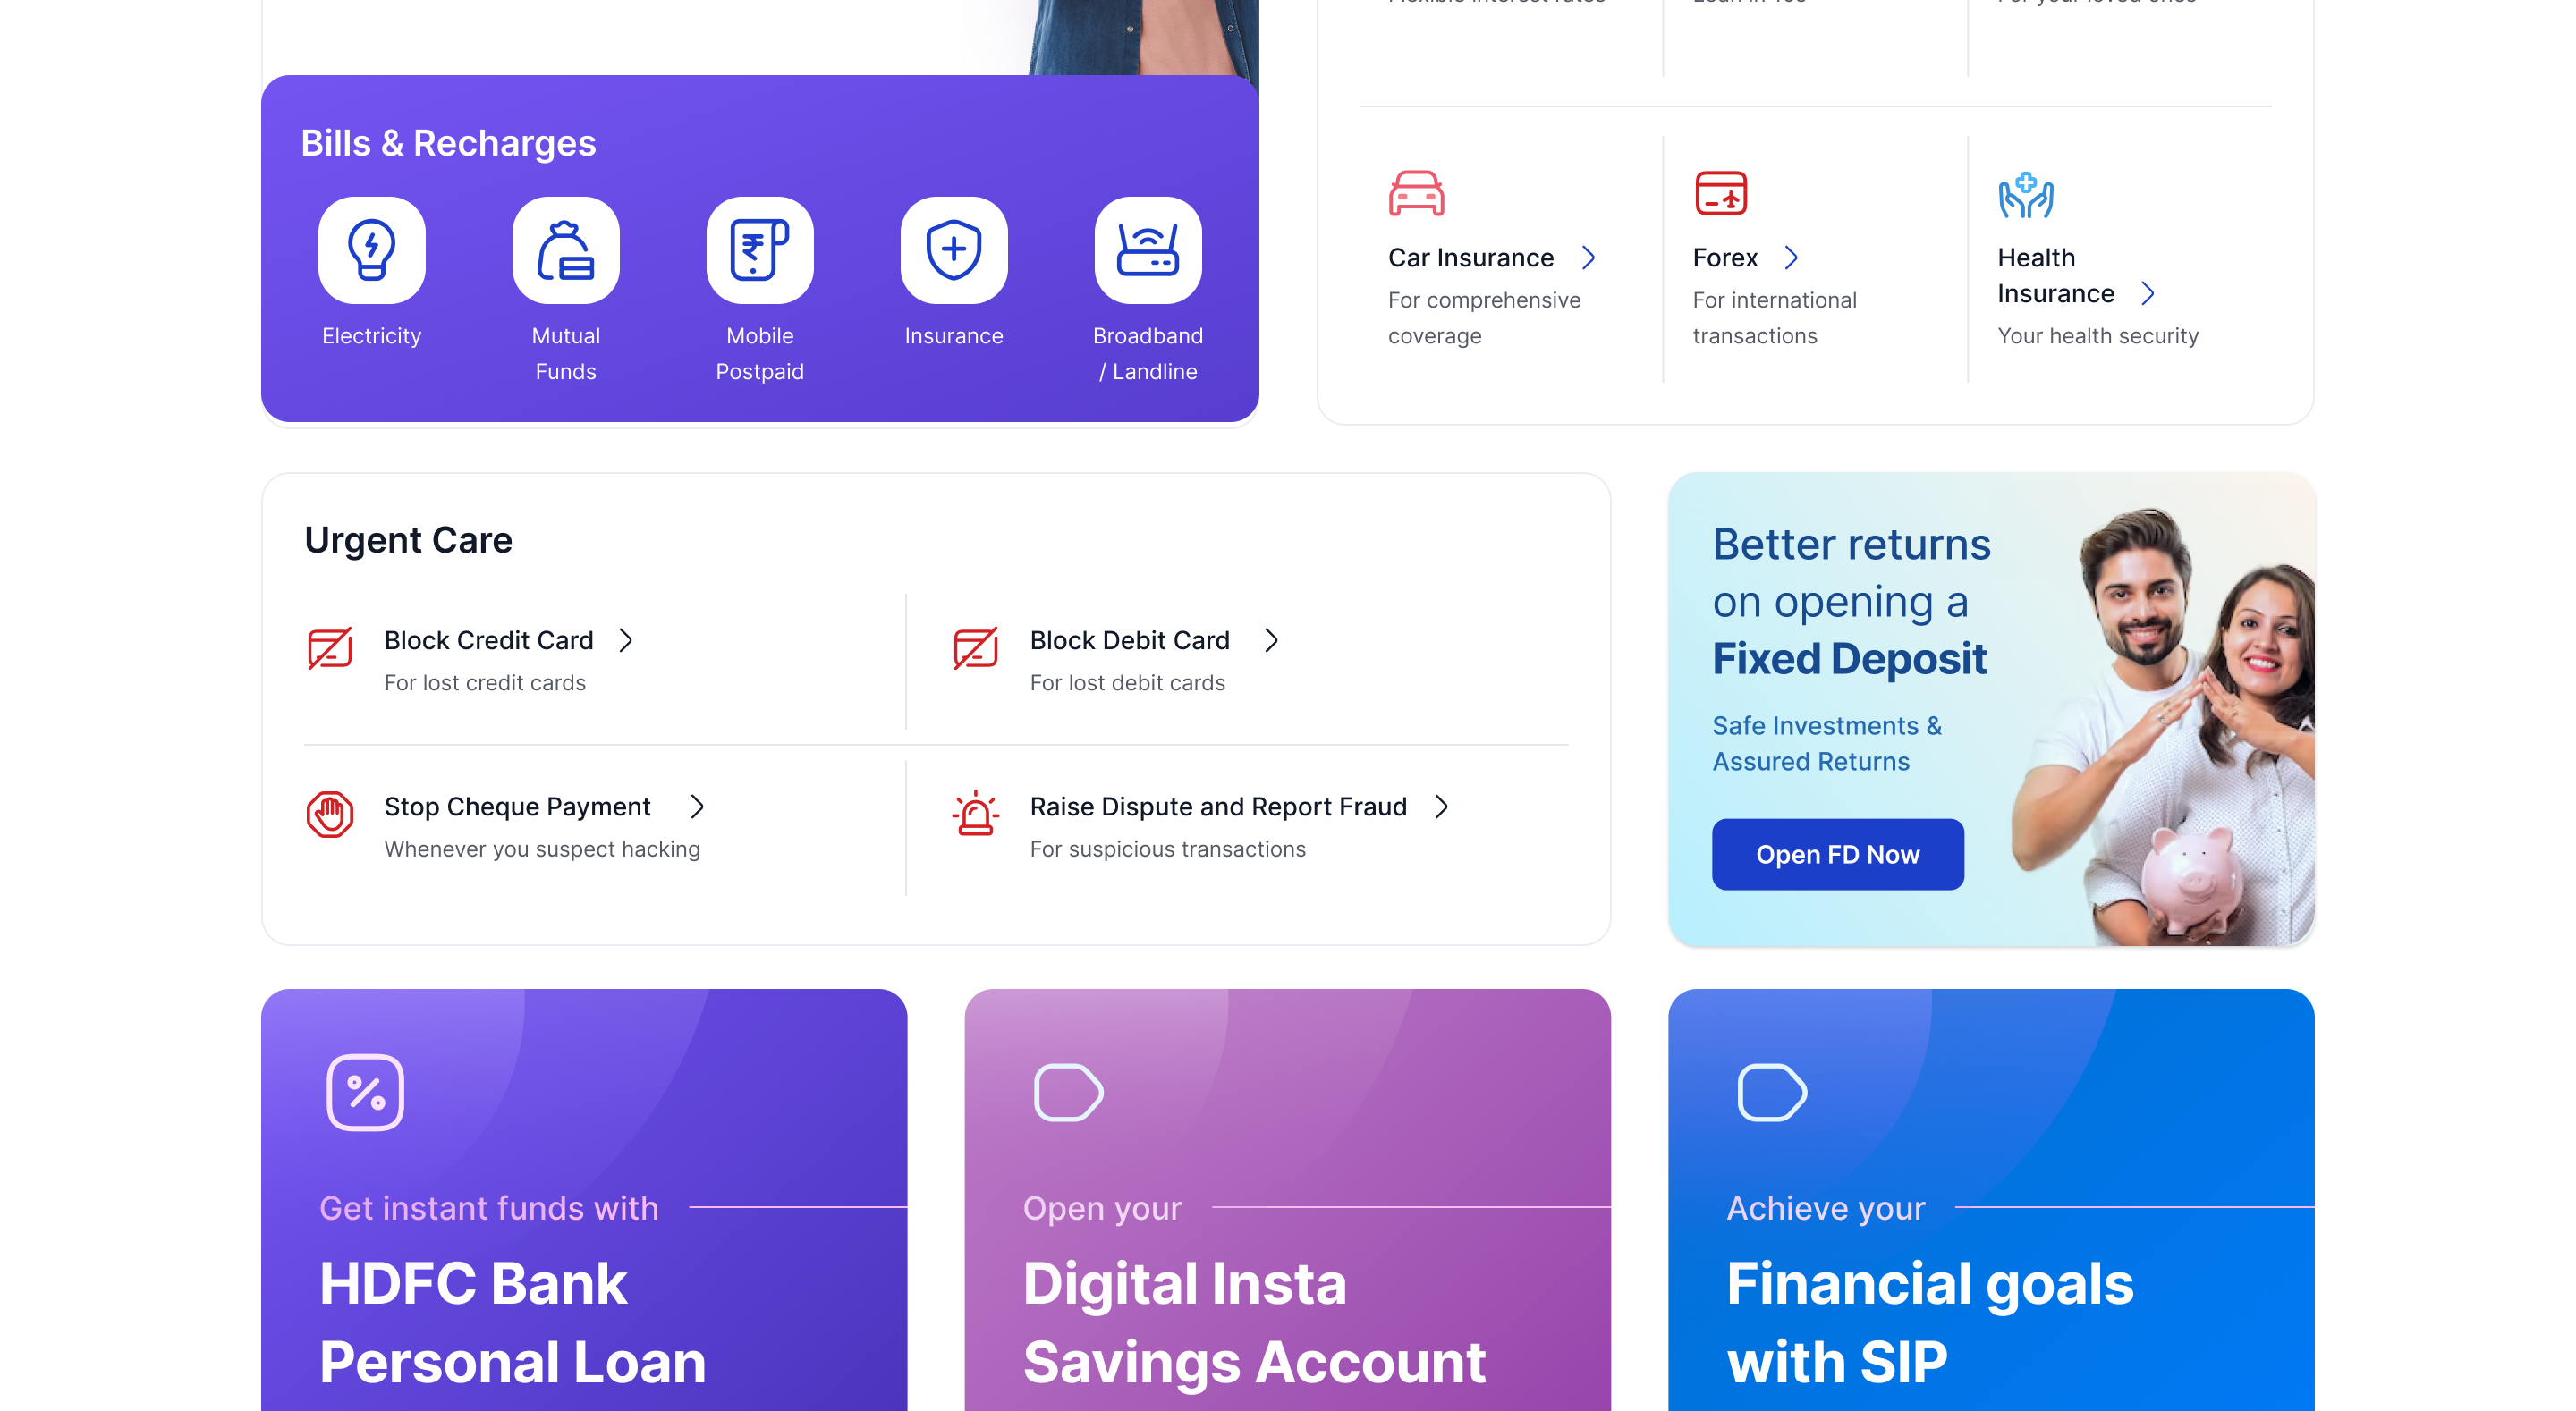
State 1: Dashboard default Urgent Actions always visible at top, personalised Quick Links module, clean account summary with clear CTAs.
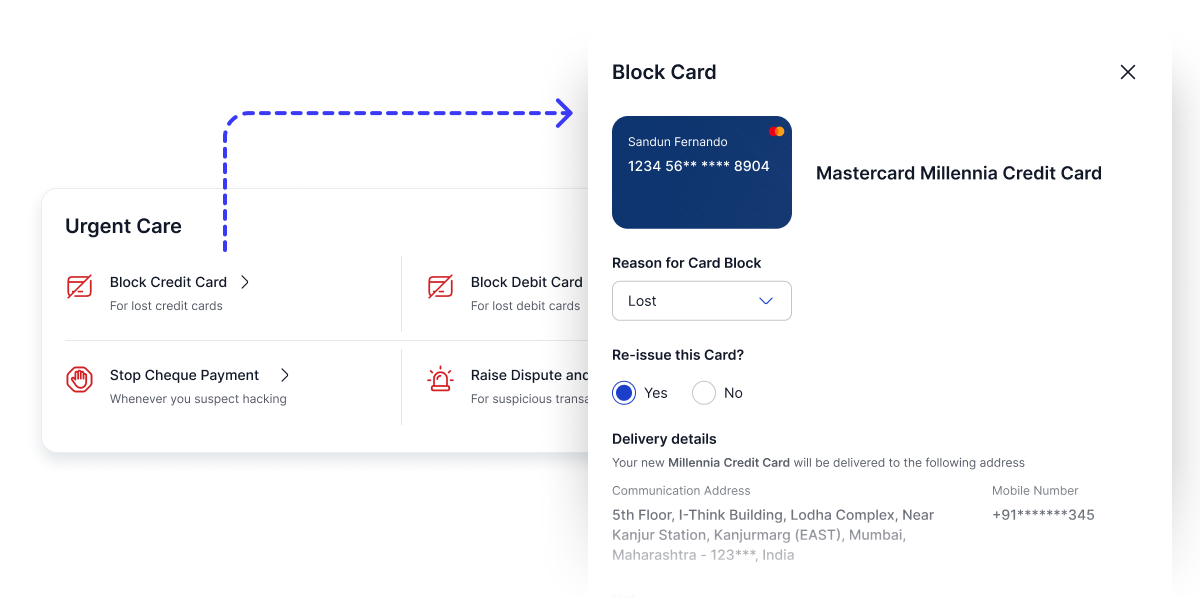
State 2: The "Block Card" emergency flow, reduced from 4+ navigation steps to a persistent top-level action. Task completion time: 240s → 38s in prototype testing.
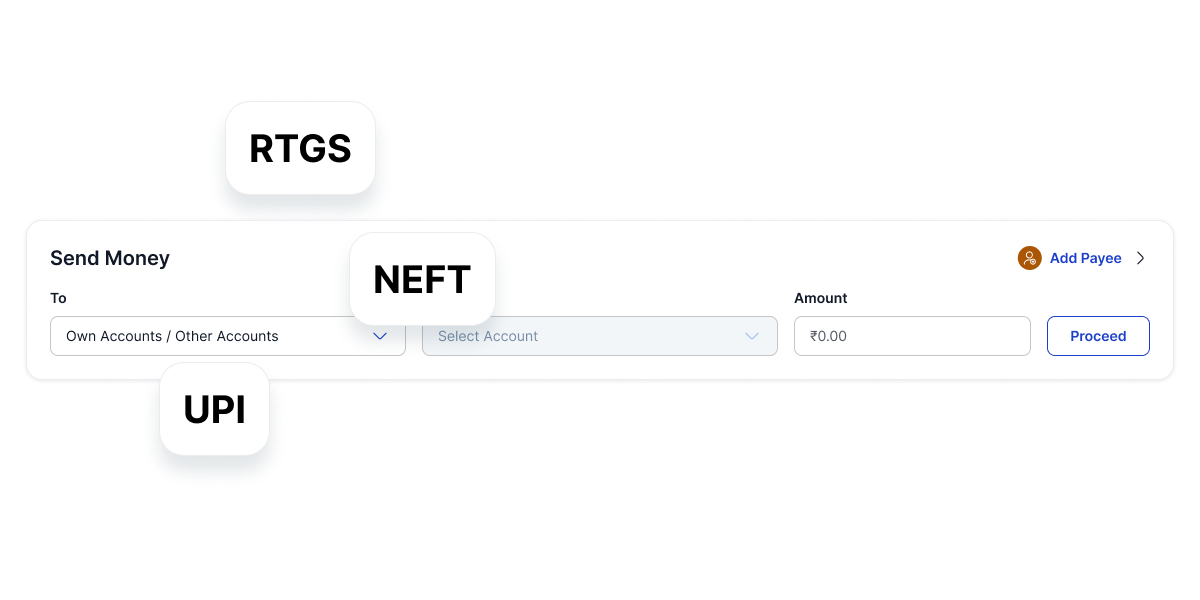
State 3: The Unified Transfer Widget combining RTGS, NEFT, and UPI behind a single "Send Money" entry point with plain-language guidance. Transfer success rate: 85% → 100% in prototype testing.
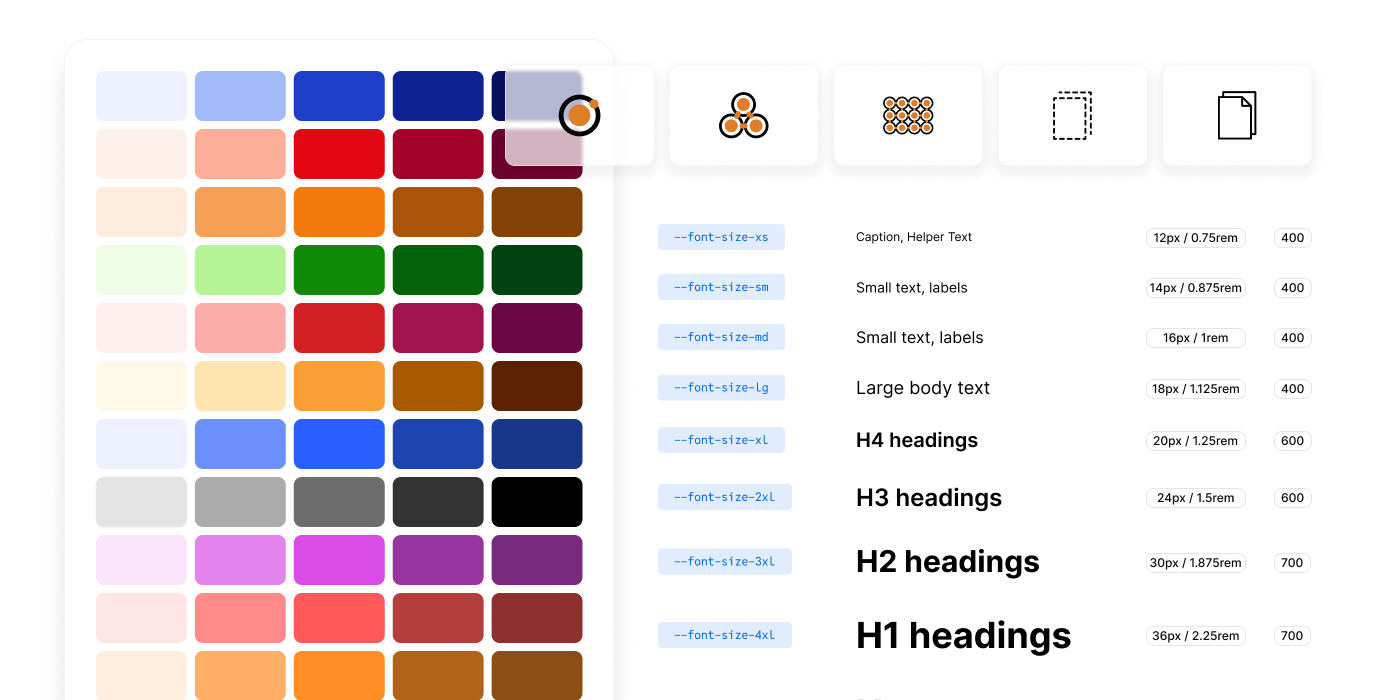
Token-based design system ensuring visual consistency across 40+ components. Colour, typography, and spacing tokens aligned with Backbase component architecture.
Design doesn't happen in isolation
This project required navigating between the client's product team, engineering, and external stakeholders while working within the constraints of the Backbase platform. Several moments required deliberate cross-functional effort to keep the redesign on track.
Convincing stakeholders to expand the scope
The original brief was a visual refresh. Moving to a full IA restructure required presenting the support ticket data and usability session recordings making the cost of inaction visible. The service blueprint was the turning point: it showed stakeholders exactly how the redesign would reduce operational overhead.
Engineering constraints shaping design decisions
Working within Backbase's component model meant some design patterns I initially proposed weren't feasible without significant custom development. We ran working sessions with engineers early adapting designs to work with existing components, not against them. This is where the Impact/Effort matrix paid off: it made the trade-off conversations concrete.
Involving support team agents (late, but valuable)
We used support ticket data extensively, but interviewed support agents too late in the process. They surfaced nuances that raw data couldn't - specific phrasing users used when confused, common misunderstandings about feature names. I'd involve them in week one on future projects.
How we arrived at the solution
Service Blueprinting
Mapped the front-stage user experience against the back-stage legacy banking systems for the HDFC portal.
Impact/Effort Matrix
Ran a prioritizing session with Backbase engineers to decide which legacy features to migrate first based on user value and technical debt.
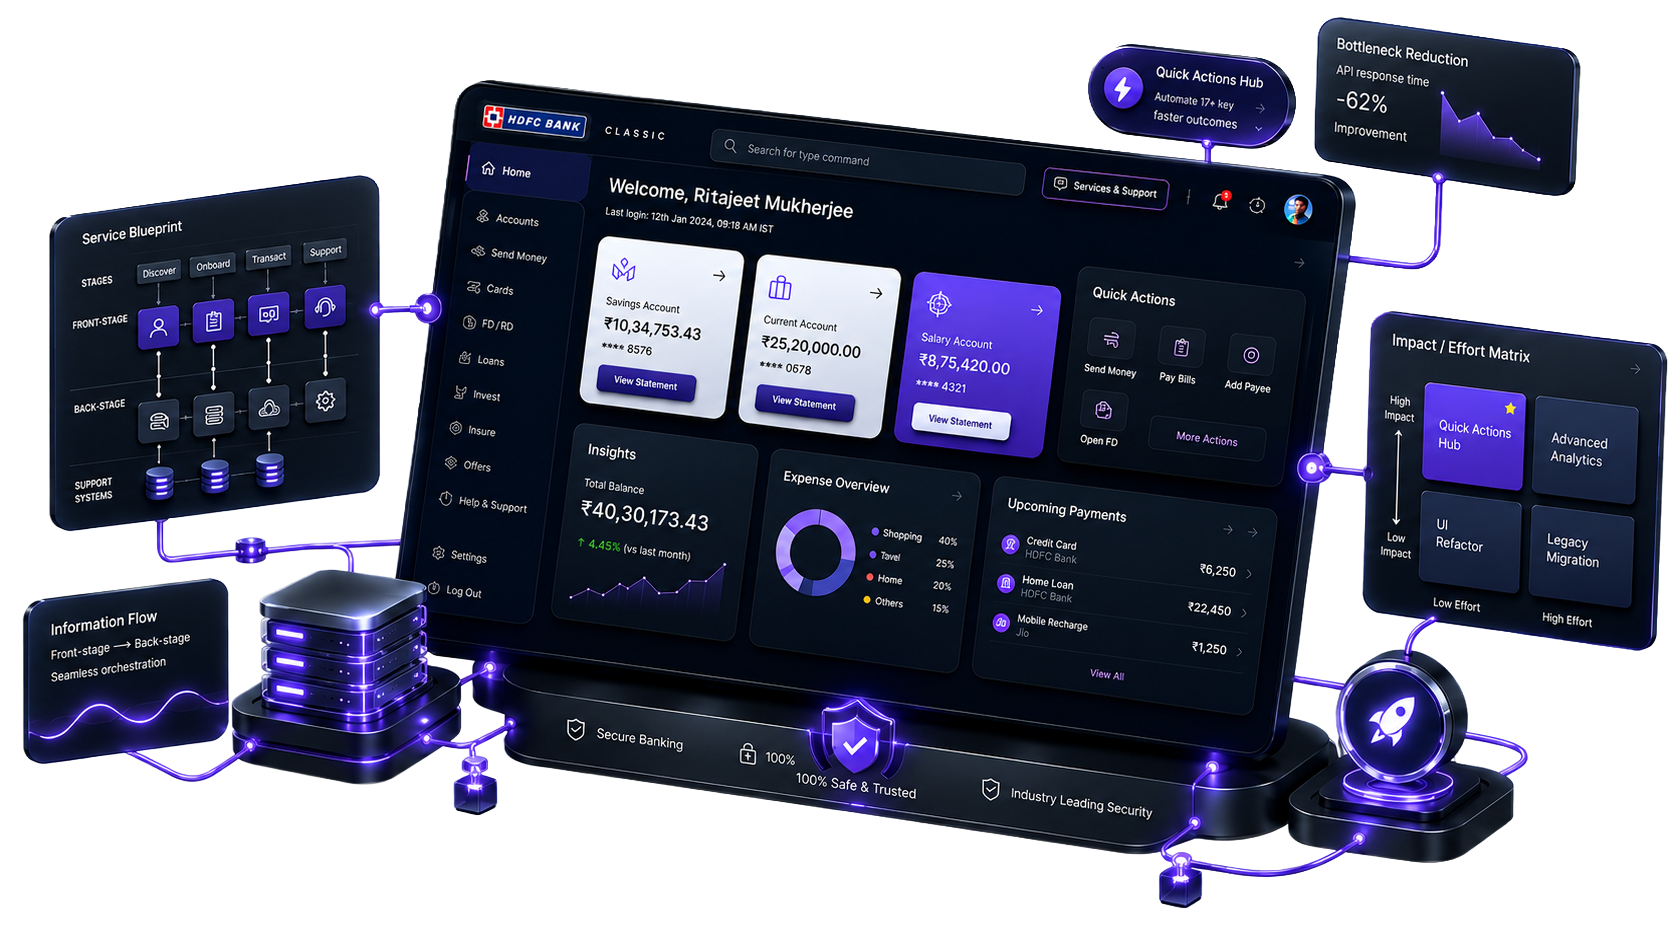
The Impact/Effort matrix session with Backbase engineers, mapping feature migration priorities based on user value and technical debt.
Prototype testing results validated before production
All metrics below are from moderated and remote prototype usability testing (n=15). Production measurement was not in scope for this consulting engagement, but the service blueprint established a projected operational cost case.
Honest reflections from someone who'd do a few things differently
What Worked
Tickets before interviews, data before assumptions
Running the support ticket analysis before any user interviews gave us quantitative proof of failure points. When we walked into stakeholder conversations, we weren't asking for research budget, we were presenting evidence that a structural problem existed. That changed the dynamic.
The service blueprint as a stakeholder tool, not just a UX artefact
Using the service blueprint to make the operational cost case visible showing exactly which support call types would be eliminated was the moment the project scope was extended. It translated design work into business language.
Platform constraints as design parameters, not obstacles
Working within Backbase's component model early before any high-fidelity work meant the designs that reached engineering were already feasible. Running "Engineering Feasibility Reviews" after each design phase saved significant rework.
What I'd Do Differently
Involve support agents in week one, not week six
We used ticket data extensively but brought support agents into interviews too late. They held pattern knowledge that data alone couldn't surface specific phrasing users used when confused, recurring misunderstandings about feature names. Earlier involvement would have sharpened our insight phase significantly.
Push harder for production measurement instrumentation
Our impact metrics are from prototype testing which is credible, but not the same as production data. On future consulting engagements I'd advocate strongly for instrumentation scoped into the delivery plan from the start, so the business case can be validated post-launch, not just asserted.
Design for low-digital-literacy users from the start, not as an afterthought
Our initial interview cohort skewed toward digitally confident users. Adding 3 sessions with lower-literacy users mid-project changed some navigation decisions significantly. Those sessions should have been week one, not week five.